
Life expectancy
The most comprehensive criteria for judging the overall impact of social and environmental conditions in a country is average life expectancy – as this sums up and balances the combined effect of all positive and negative economic, social, environmental, health, educational and other trends. Life expectancy is therefore a more adequate measure of social well-being than purely per capita GDP – significant as the latter is, and despite per capita GDP being the single biggest determinant of life expectancy. As Nobel Prize winner Amartya Sen summarized regarding the relation between these variables:
‘Personal income is unquestionably a basic determinant of survival and death, and more generally of the quality of life of a person. Nevertheless, income is only one variable among many that affect our chances of enjoying life… The gross national product per head may be a good indicator of the average real income of the nation, but the actual incomes enjoyed by the people will also depend on the distributional pattern of that national income. Also, the quality of life of a person depends not only on his or her personal income, but also on various physical and social conditions… The nature of health care and the nature of medical insurance – public as well a private – are among the most important influences on life and death. So are the other social services, including basic education and the orderliness of urban living and the access to modern medical knowledge. There are, thus, many factors not included in the accounting of personal incomes that can be importantly involved in the life and death of people.’[1]
Life expectancy is such a sensitive indicator or overall social conditions because it sums up in a single figure all positive (rising living standards, good education, good health care, environmental protection) and negative (poverty, lack of education, poor health care, pollution) trends. Data on the impact of social conditions, health, environment, education etc. show that China’s life expectancy is better than would be expected purely from its economic development. This, evidently, again does not indicate that there are not negative factors, nor is this being argued, but that these are clearly and considerably outweighed in China by positive trends.
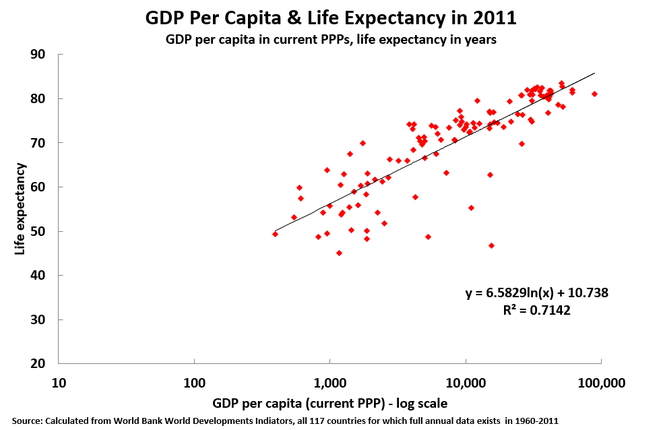
This fact can be tested objectively. To provide an overall framework Figure 1 confirms clearly the high degree globally to which life expectancy is primarily determined by the direct and indirect consequences of a country’s per capita GDP – prosperity makes you live longer! It shows the correlation of per capita GDP and life expectancy in 2011 – the latest year for which comprehensive international data exists. Coverage is for all 117 countries for which annual records exist from 1980-2011 – these states include the overwhelming majority of the world’s population. It may be seen differences in per capita GDP account for 71% of differences in life expectancy.[2]
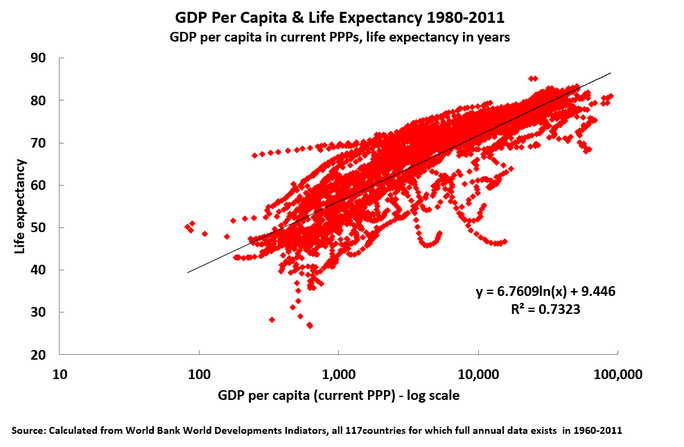
In order to explore this correlation with the most comprehensive data available Figure 2 shows the relation between per capita GDP and life expectancy for every country for every year between 1980 and 2011 in which World Bank comparative statistics exist for even a single year. Taking this larger sample, per capita GDP accounts for 73% of the differences in life expectancy between countries. In short, per capita GDP is the overwhelmingly decisive factor in life expectancy.
Other factors in life expectancy than GDP
It may be seen immediately from the above data that life expectancy rises rapidly with increases in per capita GDP – internationally, on average, doubling GDP per capita adds four years and six months to a man’s life expectancy and five years to a woman’s. But this itself is a key fact for discussion of international development as well as that of China. It shows it is a fundamental mistake to present GDP growth as simply a question of accumulating steel or chemicals, as is sometimes suggested. Instead rising GDP has dramatic social and personal consequences – i.e. rising per capita GDP is not socially ‘neutral’ but is highly socially positive. An accurate judgement regarding China was therefore made by David Pilling in the Financial Times: ‘Life expectancy has more than doubled from 35 in 1949 to 75 today, a miraculous achievement.’[3]
Nevertheless, although almost three quarters of differences in life expectancy between countries are explained by per capita GDP, this equally means that slightly over a quarter of such differences are determined by other factors – again indicating life expectancy is a sensitive indicator of overall social wellbeing.[4] These differences measure the positive or negative effects of environmental, health, education and other factors in addition to the quantitatively dominant one of per capita GDP.
In 2011, on the basis of international averages, China’s life expectancy would be 70 based on its per capita GDP, but it was actually 73 on World Bank data. For comparison in the US life expectancy would be expected to be 81 but was actually 79. In China people live therefore three years longer than would be expected from its level of economic development, whereas in the US life expectancy is two years less than would be expected from its economic development level. China’s data therefore clearly demonstrates that far from health services, environment, education etc. being negative factors they add to life expectancy, whereas in the US these other factors subtract from it.
What life expectancy shows about social conditions in China
A more comprehensive examination confirms these key trends. It is relatively simple to compare a country’s economic development with its life expectancy. Comparing a country’s rank in world per capita GDP with its rank in life expectancy shows whether factors other than per capita GDP are leading to a country’s people living longer or less compared to what would be expected solely from its economic development level.[5]
Table 3 therefore shows the rank for per capita GDP and rank for life expectancy for the major economies – the G7 plus the BRIC developing economies. These are sub-divided into the 7 major advanced economies and the 4 major developing economies. As can be seen, China rates 86th in per capita GDP but 75th in life expectancy – i.e. China’s life expectancy is 11 places higher than would be expected from its level of economic development.
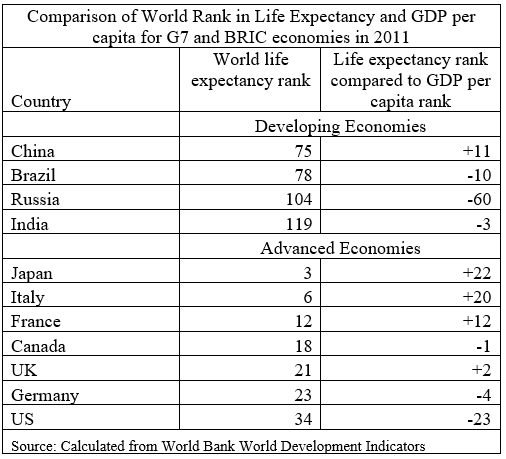
Considering first developed economies:
- Life expectancy in the UK and Germany is close to what would be expected from per capita GDP.
- France, Japan and Italy all have life expectancies which are significantly higher than would be expected from their per capita GDP.
The strikingly negative data is for the US. Life expectancy in the US is significantly shorter than would be expected from its level of economic development. The US has the highest per capita GDP of any major developed economy but the lowest life expectancy – life expectancy is 83 in Japan, 82 in Italy and France, 81 in the UK and Germany, 80 in Canada but only 79 in the US. The inhabitant of any other major developed country should therefore expect to live longer than in the US. US life expectancy rank is 23 places below where it would be expected to be judged only by per capita GDP. In the US there is therefore clearly a significantly negative effect of factors other than GDP per capita – such as health services, environment, education etc.
China and the BRICS
If the US has a far lower life expectancy than other major developed countries, the situation with China is the reverse. China has the longest life expectancy of any of the major developing BRIC economies, even although it does not yet have the highest of their per capita GDP’s. Life expectancy was 66 in India, 69 in Russia, 73 years and 5 months in Brazil and 73 years and 6 months in China – despite Brazil’s per capita GDP being 29% higher than China’s and Russia’s per capita GDP being more than double China’s.
Returning to a bilateral comparisons with the US, therefore far from China’s health services, environment, education etc. detracting from its social situation they clearly augment it compared to what would be expected purely from its per capita GDP, whereas in the US the effect of such factors are negative. In short the overall effect of social and environmental conditions, compared to per capita GDP, is negative in the US but positive in China!
This data evidently casts a clear light on discussions regarding China’s economy and social conditions. As people in China live significantly longer than would be expected, given China’s level of economic development, any claim China’s rapid rise in GDP or consumption is more than offset, in terms of rising living standards, by health, environmental or other considerations is false – the reverse of reality. Overall China’s life expectancy is three years higher than would be expected from per capita GDP – showing that the positive balance of health, environmental, educational and other factors significantly outweighs negative ones. The evidence is therefore clear that environmental, health and other factors affecting life quality are superior in China than would be expected for its level of economic development.
Such data is naturally not intended as grounds for complacency. What have been analysed here are growth rates, and position relative to economic development, not absolute levels. China’s life expectancy on World Bank data (73.5 years) is still significantly behind the US (78.6 years) let alone Italy (82.1 years) or Japan (82.6 years). Consequently, China must still undergo a prolonged period of economic development before it achieves the highest levels of advanced economies. More precisely. for people in China to live even longer in the future, which in turn is a key indicator of quality of life, two things are required.
- Above all, China’s GDP must continue to grow – this will contribute almost three quarters of any increase in life expectancy.
- China must maintain, and if possible improve still further, those factors which mean people in China already live longer than would be expected from its level of economic development.
As a long life would certainly be part of most people’s ‘China dream’ seriously internalizing these facts in discussion of economic policy is rather important – indeed a literally ‘life or death’ question!
GDP growth and living standards
Finally, these social facts cast light on the discussion in the recent period in China that the goal of economic policy should be increase in living standards, not GDP growth. This point is correct but as formulated is misleading, as it neglects the fact that increase in per capita GDP is not socially neutral, but is highly correlated with desirable social trends reflected in increase in life expectancy. As shown above, other factors can reduce life expectancy below that which would be expected from per capita GDP – or can increase life expectancy above the level that would be expected from per capita GDP. Therefore, the goal of policy should, indeed, be the most rapid possible sustainable increase in living standards, not GDP growth. But it is necessary not to throw the baby out with the bathwater. It has to be clearly understood it is impossible to achieve high living standards without GDP growth. The fallacious idea that ‘prosperity can be achieved by sharing out scarcity’ used to be an argument of extreme ‘leftist’ views in China.[6] However a new ‘rightest’ variant has emerged in which it is argued that China does not need high GDP growth to achieve high living standards.
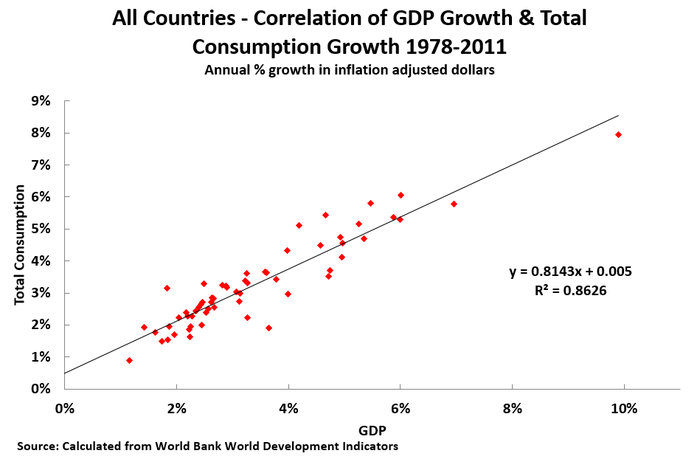
The fallacy of this argument can be illustrated simply. Figure 3 shows the correlation between GDP growth and total consumption growth for all countries for which World Bank data exists for the period 1978-2011 – the latest available statistics for most countries. Increases in GDP account for 81% of increases in consumption with a correlation of 0.86 – an extraordinarily close relation. In short, nothing else even comes close to accounting for increases in consumption as GDP growth. High living standards in China can only be achieved by high economic growth.
The consequences of this reality also may be illustrated by a bilateral comparison with the US. Despite China’s economic growth, US per capita GDP is over four times China’s even measured in PPPs. To simplify comparisons, if it is assumed both the US and China invested nothing, then even if the whole of China’s existing GDP were shared out among its population the average person in China would only have per capita consumption less than one quarter that of the US. Anyone who believes China can content itself with a living standard less than one quarter that of the US clearly does not know what ‘prosperity’ constitutes.
Taking into account the extremely close correlation between GDP growth and consumption, and the dominant effect of per capita GDP on life expectancy, China’s long term goal cannot be less than living standards equal to the highest in the world. To achieve this aim, consequently, China must undergo rapid GDP growth continuing for several decades. High GDP growth is therefore not the aim of economic policy, that should be the maximum sustainable rate of growth of living standards and national regeneration. But nevertheless it remains the case that prosperity cannot be achieved without a high rate of economic growth.
[1] Sen, A. ‘Mortality as an indicator of economic success and failure’. The Economic Journal, 108(446), 1-25. p. 6
[2] The shortest life expectancy being Sierra Leone’s 48 years and the longest being Hong Kong and Switzerland’s 83 years.
[3] Pilling, D. ‘The ghost at China’s third plenum: demographics.’ Retrieved February 16, 2014, from Financial Times: http://www.ft.com/intl/cms/s/0/2b6f8a7c-46d3-11e3-9c1b-00144feabdc0.html?siteedition=intl#axzz2jmQGmWfu
[4] In some countries people live longer than would be expected from its level of economic development, while in others lives are shorter than would be expected purely from per capita GDP.
[5] For example, taking countries with continuous data records back to 1960, on the data published by the World Bank in 2014 Zambia ranks 99th in the world in GDP per capita, but 111th in life expectancy – its life expectancy is lower than would be expected given its level of economic development. Spain, ranks 24th in GDP per capita but 5th in life expectancy – its people live significantly longer than would be expected given its economic development level. Such differences indicate that the consequences of health care, environment etc. are better in Spain, and worse in Zambia, than would be expected from their overall level of economic development.
[6] This was pointed out numerous times by Deng Xiaoping. For example as put by Deng Xiaoping in 1979: ‘The aim of our revolution is to liberate and expand the productive forces. Without expanding the productive forces, making our country prosperous and powerful and improving the living standards of our people, our revolution is just empty talk. We oppose the old society and the old system because they oppressed the people and fettered the productive forces. We are clear about this problem now. The Gang of Four said it was better to be poor under socialism than to be rich under capitalism. This is absurd.
‘Of course, we do not want capitalism, but neither do we want to be poor under socialism. What we want is a socialism in which the productive forces are developed and the country is prosperous and powerful. We believe that socialism is superior to capitalism. This superiority should be demonstrated in that socialism provides more favourable conditions for expanding the productive forces than capitalism does.’ Deng, X. (30 March 1979). Uphold the Four Cardinal Principles. In 2001 (Ed.), Selected Works of Deng Xiaoping Vol. 2 1975-1982 (pp. 166-191). Honolulu: University Press of the Pacific.
Related articles
Trump’s economy – cyclical upturn and long term slow growth

What China achieving ‘moderate prosperity’ means for itself & the world
New economic data shows disorientation of US foreign policy analysts

My Thoughts on Receiving China’s Top Book Award for Foreign Writers on China