
For China to most effectively counter such campaigns in the US it is useful to understand why ‘China bashing’ is against the interests not only of China but also against the interests of the people of the United States themselves. As China-US relations are the world’s most important bilateral country relations the dynamics involved between the two countries will also play a key role in the overall global situation.
The 2016 Presidential campaign
As all major political analysts in the US rightly explained the 2016 US Presidential election was the most polarised and destabilised since at least the Great Depression. Trump defeated every candidate of the Republican Party establishment to gain the Party’s nomination for President. Simultaneously for the first time for almost a century a candidate openly calling themselves a socialist, Bernie Sanders, received mass support for US President and very seriously challenged Clinton in the Democratic Party primaries.
Both the final presidential candidates had more people unfavourable to them than favourable. Going into the last 10 days of the campaign the average of US polls showed 52% of the US electorate had an unfavourable opinion of Clinton, compared to 45% with a favourable one. Simultaneously 59% of the US electorate had an unfavourable opinion of Trump compared to 38% with a favourable one. This data shows clearly the US electorate was therefore more voting against particular candidates than in favour of them.
Attitudes towards the US Congress were even more unfavourable than towards the Presidential candidates. Regular polls carried out for the leading US research agency Pew showed that in 1995 53% of the US electorate had a favourable opinion of the work of the US Congress and 37% an unfavourable one – a net favourable rating of 16%. By 2015 those with a favourable rating were only 27% compared to 69% with an unfavourable rating – a net unfavourable rating of 42%. By October 2016 Gallup found in a poll asking ‘Do you approve or disapprove of the way Congress is handling its job?’ 76% said they disapproved compared to 20% who said they approved – a net disapproval rating of 56%.
In summary, by 2016 the US public disliked both Presidential candidates and very strongly disapproved of the US Congress. Given this situation the strong support of candidates from outside the political mainstream and the US ‘centre ground’ was entirely logical.
Trends in income
The economic roots of this deep dissatisfaction in the US electorate were clear. US median household incomes by 2015 were still 2.4% below the level of 16 years previously. At the trough of the Great Recession, in 2012, US median household incomes were 9.1% below their 1999 peak level. The US population had therefore suffered more than a decade and a half of seriously lowered incomes – which by itself would produce deep political discontent and anger in any country.
But the political consequences of the trend of falling US incomes was made worse by the great increase in US inequality and the falling share of incomes received by the overwhelming majority of the US population. The share of total US incomes received by the bottom 80% of the US population, the overwhelming bulk of the US people, fell from 56% in 1967 to 49% in 2015. Over the same period the share of total incomes received by the top 20% of the US population rose from 46% to 51%. Therefore, by 2015 the top 20% of the US population was receiving a higher share of US total incomes than the bottom 80%.
This inequality has risen radically since Reagan became President in 1981. From 1980 to 2015 the share of incomes of the bottom 20% of US households fell from an already low 4.2% to 3.1%. Simultaneously the share of incomes of the top 5% of US households rose by an extremely sharp 5.6% – from 16.5% to 22.1%. The share of total incomes in every household income group in the bottom 80% of the US population declined – the total fall for 80% of the population being an extremely severe 7.1%, from 55.9% to 48.8%.
Given these extreme increases in income inequality in the US after 1980 the severe increase in US political instability is entirely logical.
Growth rate
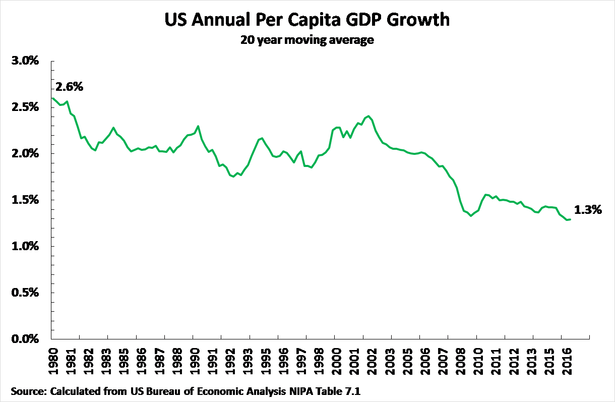
The fundamental economic reasons behind these negative trends in US incomes are equally clear. Taking a 20-year moving average, to remove all effects of short term business cycle fluctuations, Figure 1 shows that between 1980 and 2016 the annual growth rate of US per capita GDP fell by half – from 2.6% to 1.3%. The fact slow economic growth was accompanied by a radical increase in inequality explains why US median household incomes fell.
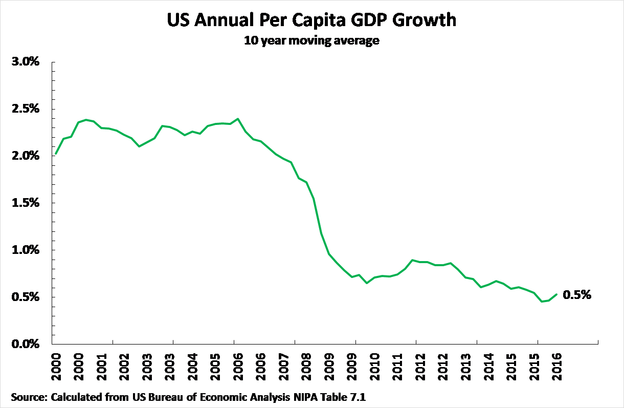
In the recent period, this slowdown in the US economy has become more severe. As may be seen from Figure 2 under the impact of the international financial crisis the 10-year moving average of annual per capita GDP growth in the US fell to 0.5% – close to stagnation. With such a low level of per capita economic growth significant increases in the living standards of the American people are almost impossible.
Half a century of a slowing US economy
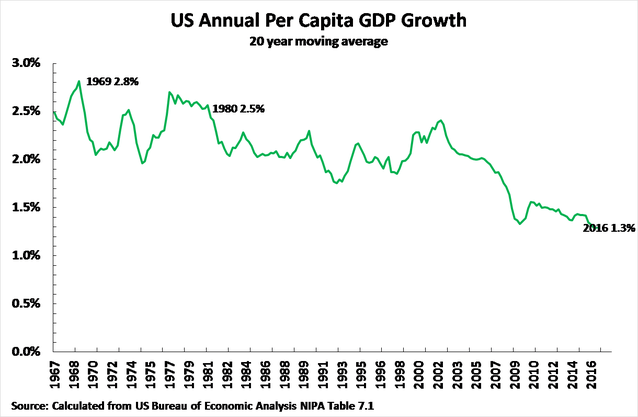
Finally, in order to complete the picture, it should be understood that while the slowdown in the US economy has become more extreme since 1980 this is only part of a much more long term trend: the US economy has been slowing for half a century. As shown in Figure 3, again taking a 20 year moving average to remove business cycle effects, the peak of post-World War II US per capita GDP growth was reached in 1969 at 2.8%. This then slowed slightly to 2.5% by 1980, before the decline accelerated to only 1.3% by 2016. As shown in Figure 2 the 10-year average was still lower at 0.5%.
In short the US is locked into a relentless economic slowdown which has been taking place for almost 50 years. It is this which underlies the adverse trends in US household incomes and the rising political discontent and instability noted above. It is this which equally provides a background for analysing the effect on the US population of US-China relations.
A ‘win-win’ US-China economic relationship
While, as will be analysed below, foreign trade and investment is not the main factor determining recent US economic performance nevertheless the correlation of trade expansion and positive economic performance is well known both theoretically and factually. Adam Smith noted in the first sentence of the first chapter of the founding work of modern economics The Wealth of Nations: ‘The greatest improvement in the productive powers of labour, and the greater part of the skill, dexterity, and judgment with which it is directed, or applied, seem to have been the effect of the division of labour.’ Division of labour necessarily extends internationally as well as domestically. Numerous factual studies confirm the positive correlation between economic openness and faster growth.
This economic conclusion is of course also confirmed from the negative by the fact that the post-1929 relapse of the world into protectionism helped create the Great Depression – the greatest economic crisis in modern world history. It was indeed due to this catastrophic experience that after World War II the US reversed its previous protectionist course and for half a century promoted an open world trading order – with great ‘win-win’ benefits both to itself and to other countries. Globalisation brought great benefits to economies – not only to the US but also to China following the start of its ‘reform and opening up’ in 1978. A full analysis of this process may be found in my book The Great Chess Game (一盘大棋?中国新命运解析(.
In the present stage of development of globalisation, it is economic relations between China and the US which are most decisive. The US and China are the world’s first and second largest economies accounting for 39% of the world economy at current exchange rates. They are the world’s first and second largest trading nations. In summary China and the US combined are sufficiently powerful to play a decisive role in the world economy and in world trade. The key way to approach the question of the greatest development of world trade and investment is therefore via discussions between the US and China.
Furthermore, from the point of view of economic fundamentals it is easy to understand and to create the framework of mutually beneficial economic trading relations between China and the US due to the different features of the two economies. China is the world’s largest ‘upper middle income’ economy while the US is the world’s largest ‘high income’ economy. Consequently, in medium technology items China enjoys a combination of comparable technological level but with much lower wage costs that the US cannot match. Therefore, in medium and medium-high technology products China has a decisive competitive advantage. US manufacturing of these medium technology products, instead of importing them from China, would result in substantially higher prices for US consumers and producers and therefore lower US living standards and US international competitiveness.
But equally the US possesses competitive advantages compared to China in fields of high technology. China’s per capita GDP, which approximately reflects the different productivity of the two economies, is only 27% that of the US measured in PPPs – the most suitable unit for long term comparisons. Even with the best economic policies it will therefore take China several decades to reach the productivity level of the US – put in other terms the US will enjoy a comparative advantage in high technology products compared to China for several decades.
The ‘win-win’ outcome for economic relations between China and the US is therefore clear and stable for both the short and long term. China will continue to have the ability to produce medium and medium-high technology goods more competitively than the US, leading to higher living standards in the US than if the US manufactured them itself, while the US enjoys a competitive advantage in high technology products – which China would therefore have to allocate disproportionate resources to manufacture.
This fundamental basis in the complementarity of the two economies explains why trade between China and the US is so dynamic. It is well known that the US is China’s single largest country export market. But also since 1999 China’s share of total US exports has increased by 5.3%, whereas that of the EU has declined by 2.8% and Japan by 4.6%. In short growth of US exports to China is much more dynamic than to either the EU or Japan. Simultaneously China’s share in total US imports rose by 11.2% while the share of EU fell by 0.2% and the share of Japan fell by 6.0%.
A model of such ‘win-win’ relations can be seen between China and Germany – the latter being another high technology economy. China imports high quality machine tools and other equipment from Germany and exports consumer and medium and medium-high technology products. Both economies benefit – and indeed Germany actually runs a trade surplus with China.
Finally, turning to geopolitics, there is also no major necessary military confrontation between the US and China. No significant force on either side envisages a nuclear war between the US and China, as this would lead to the mutual devastation of both countries. The US is protected on one side by the Pacific Ocean and on the other by the Atlantic, so a conventional military invasion of the US is also completely impossible.
As economic ties can be mutually beneficial, and there is no necessary military confrontation, the objective basis for China and US economic relations is stable and long term. This is among the reasons why the claim there is an inevitable ‘Thucydides trap’ awaiting the US and China, a necessary violent conflict, is false. This issue is also examined geopolitically from the point of view of false historical analogies in ‘Why a US-China ‘Thucydides Trap’ Can Be Avoided’.
Having analysed the mutual benefits of ‘win-win’ relations for China and the US now the consequences for the US population of any US decision to instead confront China, that is pass from words to actions in ‘China bashing’, will be examined.
Cold War
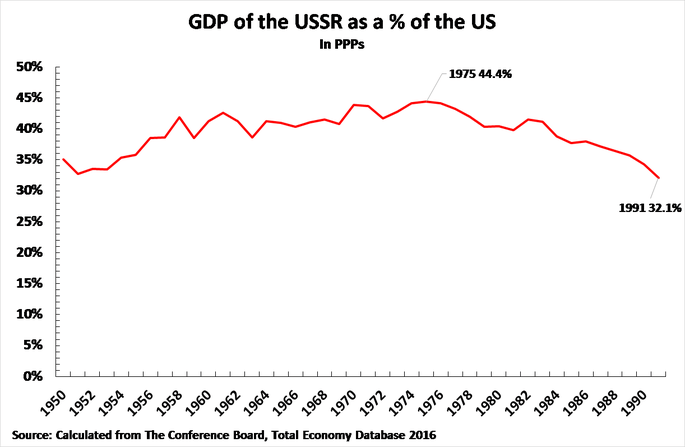
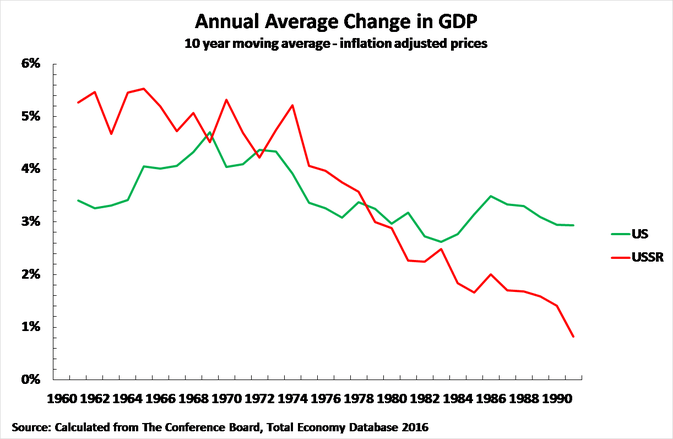
The best starting point for analysis of the consequences of a US decision to confront China is a comparison to the cold war with the USSR. The reason for US success against the Soviet Union in the cold war was a combination of the much smaller size of the USSR’s economy compared to the US with the failures of Soviet economic policy. As Figure 4 shows even at the USSR’s closest point to the US, in 1975, the Soviet economy was less than 45% of the US’s size. Furthermore after 1975, due to the lack of dynamism of the Soviet economy, the USSR fell farther behind the US in GDP so that by the time of the collapse of the USSR in 1991 the Soviet economy was only 32% of the size of the US.
It should be clearly grasped that the reason the size of the USSR’s economy fell further behind the US after the mid-1970s was not due to the dynamism of the US economy itself – as analysed above the US has suffered long term economic slowdown. The decisive factor was the drastic slowing of the USSR’s economy. Figure 5, comparing US and Soviet growth, shows the slowing of the US economy already analysed but also that the USSR’s economic slowdown was even more dramatic. Taking a 10-year moving average, from the mid-1970s onwards the Soviet economy grew more slowly than the US.
Strategy and the cold war
These trends determined the clear strategic strengths and weaknesses in the US-Soviet cold war. The USSR was extremely strong militarily, because it devoted a far higher percentage of its economy to military expenditure than the US, but the Soviet Union was undynamic economically compared to the US.
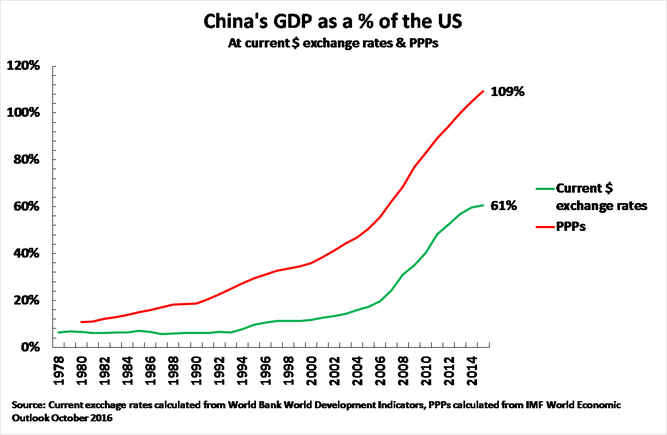
The present relations between the US and China are almost the exact reverse. The US is globally militarily stronger than China, but China’s economy is already far larger compared to the US than the USSR ever achieved. Figure 6 shows that even at current exchange rates China’s economy is already 61% the size of the US – significantly larger than the level reached by the USSR. But it is well known to economists that the exchange rates of developing economies are significantly undervalued compared to developed economies. Measured at internationally comparable prices, that is purchasing power parties (PPPs), China’s economy is calculated by the World Bank and IMF to be already larger than the US. Furthermore, China is already the world’s largest industrial producer, the world’s largest goods trading nation, and has the world’s largest annual accumulation of capital for investment.
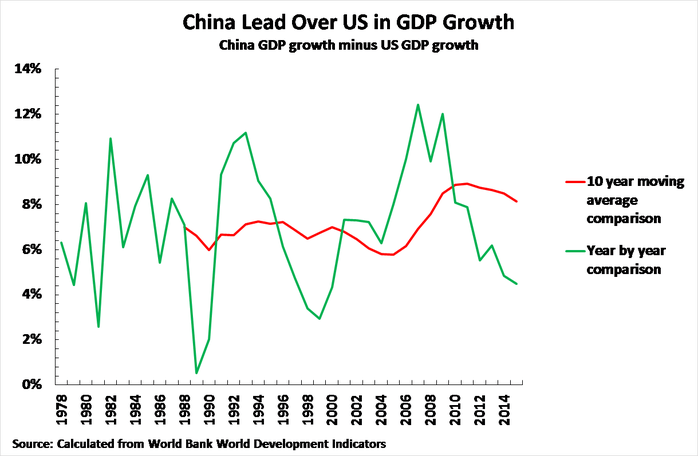
In terms of economic growth whereas after the mid-1970s the Soviet Union was growing more slowly than the US China’s economy is growing much faster than the US. While there are year by year fluctuations, in every year since 1978 China’s economy has grown more rapidly than the US – this situation was not changed with the slowing of China’s economy under the ‘new normal’ as the US economy has also slowed as analysed above. As Figure 7 shows, taking a 10 year moving average, to remove business cycle fluctuations, the lead of China’s economy growth over the US has increased. Therefore, unless major mistakes are made in China’s economic policy, the calculation must be that in any US confrontation with China China’s economy will be growing faster than the US.
Trends since the international financial crisis
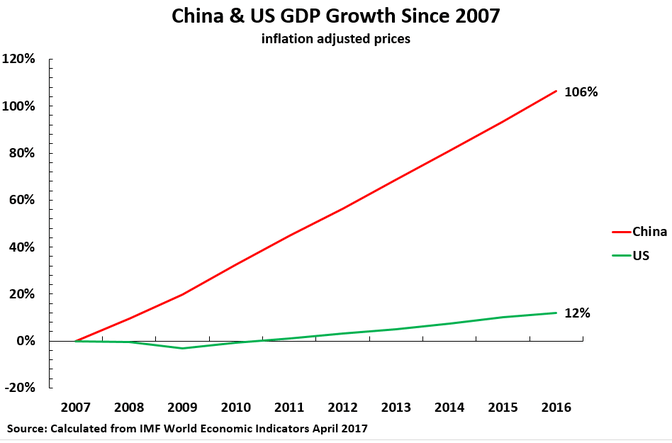
It is particularly clear that China’s economy has come through the period since the beginning of the international financial crisis far more strongly than the US. From 2007 to 2016 China’s economy grew by 106%, and the US by 12% – see Figure 8. Over this period the US annual average growth rate was 1.3% while China’s annual average growth rate was 8.4%.
The fact that the calculation for the US is that if it decides to embark on confrontation with China China’s economy will be growing more rapidly than the US in determines internal economic, social and political dynamics in the US in any such confrontation.
Cost of confrontation with China
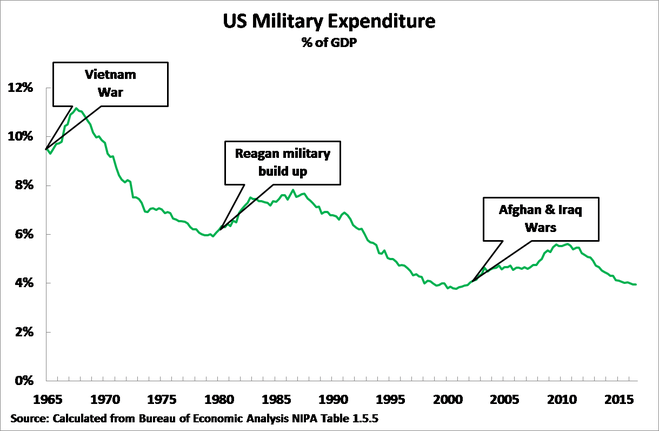
To grasp the internal dynamics within the US of a decision to confront China it must be understood that even partial US military build ups or conflicts necessarily place significant strain on its economy. Figure 9 therefore shows the percentage of US GDP devoted to military expenditure in its three major sustained conflicts during the last half century – the Vietnam war, the Reagan military build-up against the USSR in the 1980s, and the invasions of Afghanistan and Iraq after 2001. In each case necessarily major increases in the percentages of the US economy devoted to military expenditure had to be carried out – with corresponding reductions in the percentage of the economy used for civilian purposes. The extremely negative economic consequences for the US of the Vietnam war are well known, as it unleashed an inflationary wave which lasted for over a decade, therefore the focus here will be on the Reagan and George W Bush periods.
The great Reagan debt build up
The slowing of the US GDP after 1980 under Reagan was analysed above and therefore here only the internal economic consequences for the US of the Reagan period will be analysed. The fundamental process was the one by which a huge accumulation of US debt began – which culminated in the 2008 financial crisis, the sharp reduction in US household living standards already noted, and therefore the political discontent and destabilisation seen in the 2016 presidential election.
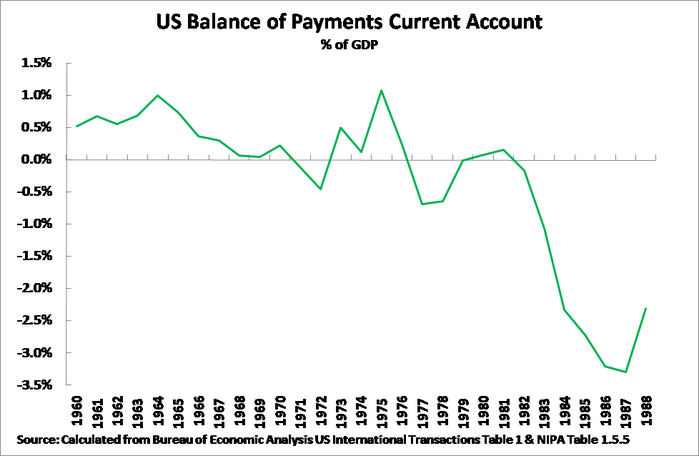
The Reagan period witnessed a radical decline in US international competitiveness. As shown in Figure 10, prior to Reagan winning the presidency in 1980 the US balance of payments, the key indicator of the US economy’s competitiveness, had remained essentially in balance despite the negative impact of the international oil price rise in 1973 – the largest US balance of payments deficit was 0.7% of GDP in 1977. In contrast, following Reagan’s election the US balance of payments deteriorated sharply – i.e. the US economy suffered from rapidly declining international competitiveness. By 1987, Reagan’s penultimate year in office, the US balance of payments deficit reached 3.3% of GDP – showing unprecedented post-World War II worsening US competitiveness.
Reagan and the accumulation of US debt
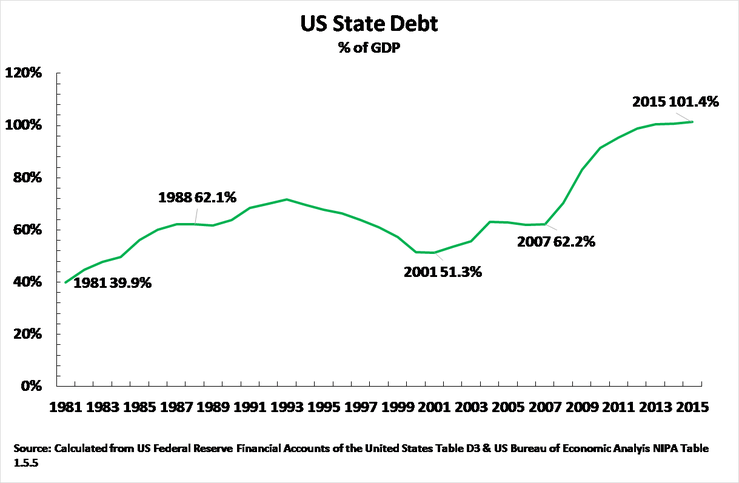
With the US economy slowing after 1980, and its international competitiveness worsening, Reagan’s military build-up against the USSR could not be financed by current US government income but only by large scale state borrowing. Figure 11 shows that Reagan sharply increased the US state debt from 39% of GDP when he became president to 61% of GDP when he left office. While in rhetoric Reagan talked about ‘small government’ in reality a policy of high military spending was carried out which could only be financed by debt. The reality was that as the US economy slowed, and international competitiveness declined, the sole area in which the Reagan military build-up showed real economic skill was in large scale borrowing!
Under Clinton, who avoided large scale wars or military build-up, the US state debt was then reduced to 51% of GDP. However, under George W Bush, with the invasions of Afghanistan and Iraq, US military expenditure increased again as a percentage of GDP reaching 62% of GDP by 2007 – as shown in Figure 9.
With slowing US growth the US was necessarily able to mount military build ups under Reagan and George W Bush only via large scale borrowing.
Rising US household debt
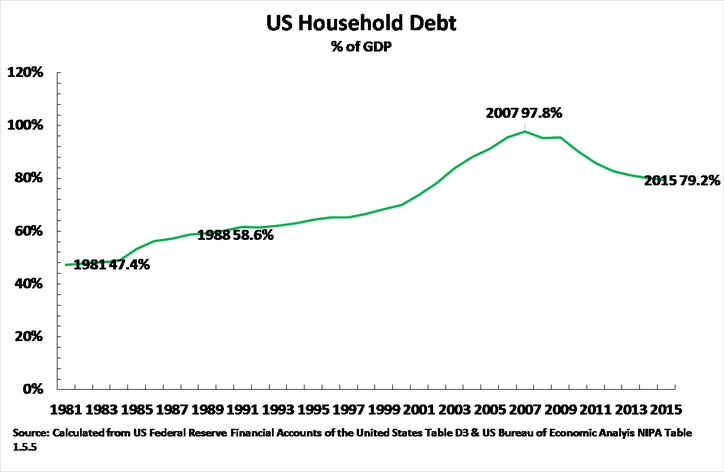
This slowing US economy, and an increasing burden of state debt caused by military expenditure, would have meant that simply on the basis of the US population’s current income downward pressure would have been exerted on the US population’s living standards. This, however, was temporarily avoided under Reagan by a continuous increase in household debt – which rose from 47% of GDP in 1981 to 59% in 1988 (see Figure 12). Under Clinton also while state debt fell as a percentage of GDP household debt continued to rise. This process continued under George W Bush – household debt reaching 98% of US GDP by 2007.
Overall rise in US debt
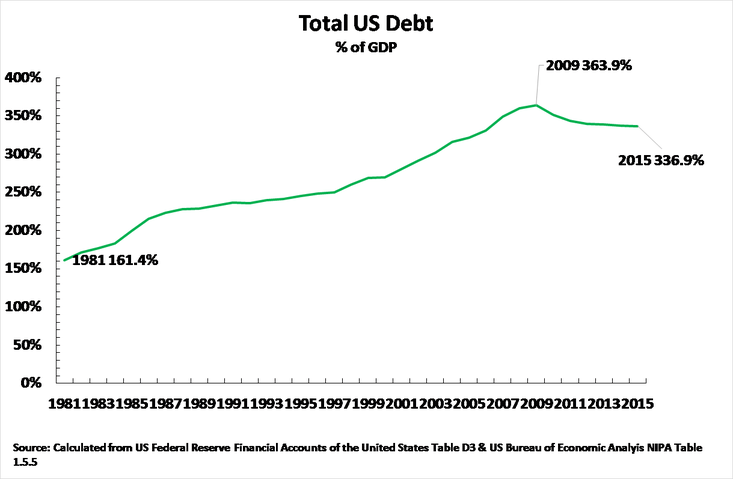
In summary the overall consequences of the process inaugurated by Reagan was therefore a huge build-up of total US debt, which rose from 161% of GDP in 1981 to 364% by 2009 – see Figure 13. The process unleashed by Reagan’s military spending, continued on the state side by the military expenditure of George W Bush, and on the household side under both Clinton and Bush, might therefore be likened to a huge ‘credit card binge’. While the huge bill on the credit card is being run up the card owner feels good as they are spending a lot! But when the credit card debt necessarily has to be paid the owner feels the deeply damaging effects.
The repayment became due with the international financial risis. With the beginning of this crisis US state debt dramatically rose from 62% of GDP in 2007 to 101% of GDP by 2015, but simultaneously with this explosion of state debt the economic consequences for the population was extremely severe. Not only did US median incomes fall below 2009 levels, as analysed above, but US households were forced to run down debt by almost 19% of GDP – from 98% of GDP in 2007 to 79% in 2015. With this combination of a fall in household incomes and the necessity of households running down debts accumulated from Reagan onwards, the deep economic and social discontent of the US population shown in the 2016 US elections was inevitable.
Obama’s foreign policy can also clearly be understood in terms of this process. Obama reduced the share of the US economy devoted to military expenditure by withdrawing large scale US combat forces from Iraq, seeking to lower the US role in Afghanistan, and resisting calls for large scale US military intervention in Syria.
Consequences of confrontation with China
These economic processes therefore make clear what would be the consequences of a US decision to confront China. Both the US military build-up under Reagan and George W Bush were limited in scope – Reagan’s aim was not to fight a war with the USSR but to put economic pressure on the Soviet Union, and it was carried out against a Soviet economy which was already growing more slowly than the US, while the military forces of George W Bush’s targets, Afghanistan and Iraq, were pitifully weak compared to China. But nevertheless, as shown above, even Reagan and Bush’s partial military build ups destabilised the US economy requiring a debt huge build up. A US confrontation with China, whose economy is growing much faster than the US and which possesses military forces enormously more powerful than the Taliban or Saddam Hussein, would require a hugely greater diversion of US resources into military expenditure, and far greater destabilisation, of the US economy than anything seen under Reagan or George W Bush. This, in turn, would determine its political dynamics within the US.
If the US is directly attacked, of course, its people will make immense sacrifices and show the same bravery as those of any other country. During the Pacific War, after Japan’s attack on Pearl Harbour, US loss of lives were small compared to China’s, but individual US soldiers fighting in Iwo Jima or Okinawa showed the same level of personal bravery as Chinese soldiers fighting against Japan’s invasion. Between 1940 and 1945 the percentage of US household consumption in GDP also fell from 69% to 53%, due to the huge diversion of resources into military expenditure, but there was no serious social discontent or destabilisation in the US – the US population logically and rightly considered these sacrifices necessary and justified to repel a direct attack on the United State launched by Japan.
But what the US population has shown since World War II, again logically and rightly, is an increasing refusal to make sacrifices for non-core US interests or conflicts. This has intensified with the slowdown in the US economy and the relative decline of US economic dominance. US public opinion has therefore shown a clear trajectory of increasing popular opposition to launching major foreign military actions unless US core interests are directly threatened. Taking historical milestones to demonstrate this trajectory, as was analysed in my book The Great Chess Games (一盘大棋?中国新命运解析):
- In 1950-53 there had been no substantial opposition in the US to involvement in the Korean war.
- The Vietnam War in 1964-75 was initially supported by the majority of US public opinion, but Vietnam led to deep political and economic problems in the US – with US majority opinion turning against the war.
- The US invasion of Iraq in 2003 was controversial from the beginning, majority opinion moved relatively quickly against it, Obama’s opposition to the war was one of the reasons he gained the Democratic Party nomination for President against Hillary Clinton, and the Iraq war is now regarded as both extremely unpopular and a serious US foreign policy error.
- When President Obama threatened military attacks on Syria in 2013 all polls showed a large majority of US public opinion opposed this.
A US decision to confront China, not even in a war but merely in an attempt to put serious pressure on China, would of course require far greater sacrifices from the US population than these conflicts. But, as shown, even local wars (Vietnam, Iraq) or military build ups against economies growing more slowly than the US (the USSR) destabilised the US economy and led to a major worsening of the position of the US population.
US public opinion as shown in polls may or may not be favourable to China, that changes periodically, but the above processes make clear there is no indication at all that the US population is willing to make the economic sacrifices required to seriously confront China. On the contrary all the evidence shows that unless China made a serious provocative miscalculation in foreign policy, unwisely aggressively threatening US core interests, or major errors in policy leading to a slowing of China’s economy, the US population is not willing to make the sacrifices necessary to seriously confront China. Having an unfavourable view in an opinion poll is not the same as willingness to accept a reduction in living standards in order to unnecessarily pick a fight with China! This is the detailed economic working out of the fundamental geopolitical processes.
Conclusion
These economic processes make clear the two fundamental paths for the US people. The first, which corresponds to the interests not only of China but of the prosperity of the US people, is for the US to seek ‘win-win’ collaboration with China. This means that in trade, for example, the most important negotiations would not be US protectionism in the TPP but to seek cooperative agreements between the world’s two biggest trading nations – China and the US. It means in foreign policy the US would seek to limit the damaging burden of military spending by lessening direct tensions with China and seeking to arrive at agreements with China, and other major powers, to lessen and contain regional conflicts. This is certainly in the interests of China but it is also in the interests of the prosperity of the US people.
The other path, that of US confrontation with China, for the fundamental reasons analysed, would mean even greater losses in living standards for the US population, and be even more economically destabilising for the US than were its confrontations with the economically declining USSR or the militarily weak Afghanistan and Iraq.
By different means both Clinton and Trump will seek to create problems with China. China’s response should be based on developing its strength – for the reasons analysed in this article the stronger China is the less willing the US people will be to undertake actions which are against not only the interests of China but against the interests of the US population itself.
In short ‘China bashing’ is not only not in the interests of China. It is not in the interests of the US people either!
Related articles

Why China will grow rich long before it grows old

Why China’s social achievements are even greater than its economic ones

The CPC has led the greatest improvement in the conditions of the greatest proportion of humanity in human history

Why Chinese neo-liberals are forced to falsify world history