The result is extremely striking. If China successfully attains “moderate prosperity” by 2020, then at current exchange rates:
- Only 19 percent of the world’s population will be in countries with a higher per capita GDP than China,
- 62 percent of the world’s population will be in countries with a lower per capita GDP than China.
China will have overtaken almost every developing country. Its level of economic development will have become higher than several countries in Eastern Europe. A country’s level of economic development, its per capita GDP, is an overwhelming determinant of improvement in overall living and social standards. Internationally almost three quarters of life expectancy, the single most sensitive all round indicator of human conditions, is explained by per capita GDP. The difference in life expectancy between a low-income economy and a high income one by international standards is twenty years – 61 compared to 81.
Pre-1978
It is necessary to note that in 1949, when the People’s Republic of China was created, China was almost the world’s poorest country – in 1950 only 10 countries out of 141 for which data can be calculated had lower per capita GDPs. In 1949 China’s life expectancy was 35 – only 73 percent of the world average.
From 1949 to 1978 China achieved a “social miracle” without precedent in world history. From 1949 until Mao Zedong’s death in 1976, China’s life expectancy rose by 29 years – from 35 to 64, increasing by more than one year for each chronological year, or from 73 percent of the world average to 105 percent. There has never been such a sustained rapid increase in life expectancy in any other major country in human history.
But if in 1949-78 China’s social achievements were historically unprecedented, its economic growth was only approximately in line with the world average.
Trends after 1978
After the 1978 “reform and opening up,” as is well known, China’s economic growth became the world’s highest. Taking World Bank data:
- Between 1978-2015 China’s annual average growth rate was 9.6 percent compared to a world average of 2.9 percent – China’s growth rate was more than three times the world average.
- As China’s population growth was relatively slow, China’s global growth lead in per capita GDP was even greater. In 1978-2015 China’s annual average per capita GDP growth was 8.6 percent compared to a world average of 1.4 percent – China’s per capita GDP growth rate was more than six times the world average.
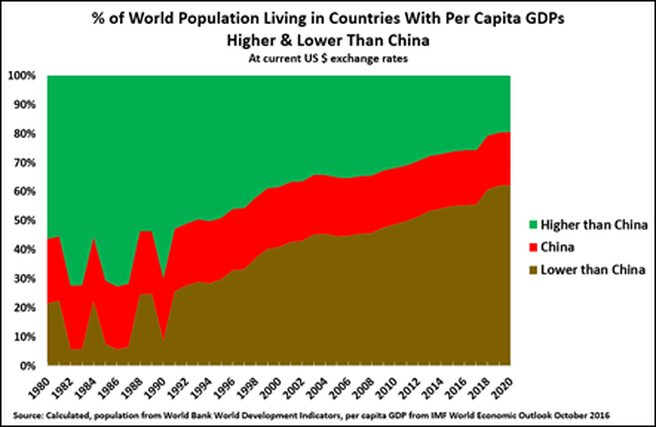
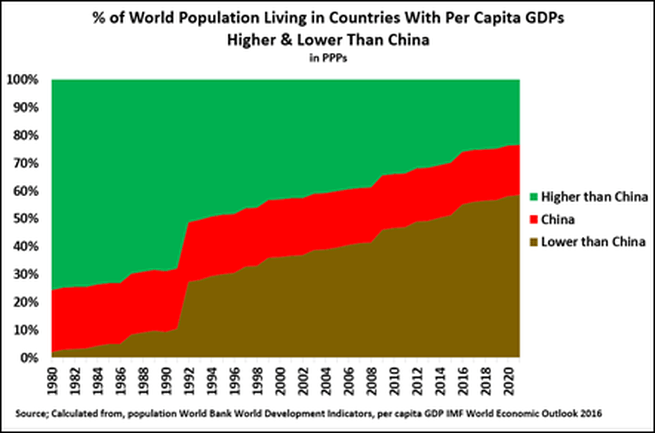
The result was the dramatic continuing rise in China’s relative position in terms of world economic development. The relevant data, showing the proportion of the world’s population living in countries with higher and lower per capita GDPs than China, is set out at current exchange rates, China’s preferred measure, in Figure 1. In internationally comparable prices (purchasing power parities – PPPs), the measure preferred by international economic institutions, the data is shown in Figure 2.
For clarity it should be noted that the sharp oscillations in China’s relative global position measured at current exchange rates during the 1980s do not reflect shifts in China’s productive economy but merely exchange rate shifts between China and India. Taking first the starting point:
- In 1980, measured in PPPs, only 2 percent of the world’s population lived in countries with a lower per capita GDP than China, while 75 percent were in countries with a higher per capita GDP.
- Measuring in current exchange rate is more complex, due to the changes in exchange rates in 1981-82. But if an average is made of 1981-82, then at that date 14 percent of the world’s population was in countries with a lower per capita GDP than China and 64 percent higher than China.
By either measure, of course, China’s relative position in the world at the beginning of “reform and opening up” was low.
The situation in 2016
By 2016, due to rapid economic development, China’s situation was entirely transformed.
- In PPPs, only 26 percent of the world’s population lived in countries with a higher per capita GDP than China, while China had a per capita GDP higher than 55 percent of the world’s population.
- At current exchange rates 26 percent of the world’s population lived in countries with a higher per capita GDP than China and 55 percent in countries with a lower per capita GDP than China.
In summary, by 2016 approximately only one quarter of the world’s population lived in countries with a higher per capita GDP than China, while the majority of the world’s population lived in countries with lower per capita GDPs than China – a total transformation of China’s situation.
2017-2020
From 2017-2020, the final period during which China projects “relative prosperity” to be achieved, economic projections must be made. Those used for calculations here are from the IMF’s October 2016 World Economic Outlook. These are chosen as they are conservative – exaggeration is of no use in analysing serious matters. The IMF data assume lower growth rates than China’s targets – an average 6.0 percent growth in 2017-2020, compared to the 2017 target of 6.5 percent and those for the 13th five-year plan (2016-2020). By 2020 on this data:
- At market exchange rates only 19 percent of the world’s population in 2020 will be in countries with a higher per capita GDP than China and 62 percent in countries with a lower per capita GDP.
- Measured in PPPs, 24 percent of the world’s population will be in countries with a higher per capita GDP than China and 58 percent in countries with a lower per capita GDP.
China has already overtaken in per capita GDP or in PPP all of the world’s other largest developing economies – India, Indonesia and Brazil. By 2020 China’s per capita GDP will be higher than several Eastern European countries.
As China has 19 percent of the world’s population, quite literally never in human history has anything approaching such a large proportion of the world’s population had its conditions of life improved so rapidly. That will be the astonishing measure of China’s success in achieving “moderate prosperity” – it is, without comparison, literally the greatest economic achievement in human history.
Related articles
Trump’s economy – cyclical upturn and long term slow growth

US calls for China to adopt policy to kill millions of Chinese by Covid in name of “human rights”

Reality & myth of the US ‘internet revolution’

Quelles sont les forces qui poussent les USA à une agression militaire internationale croissante?