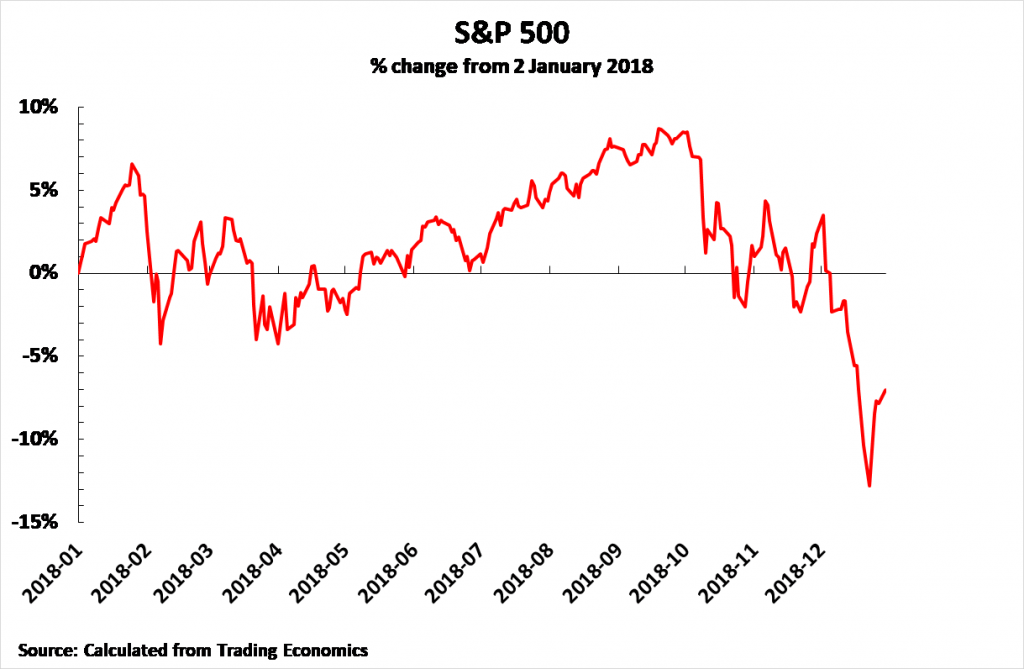
‘Mr. Trump has looked to calm markets, which have gyrated in recent days’ – that was the comment of the Wall Street Journal on the phone call between President’s Xi Jinping and Donald Trump on 29 December. The markets the Wall Street Journal was referring to in particular were US share markets. On 28 December, the day before the Presidents phone call, the S&P500, the most widely followed US share index, had fallen 15.2% from its peak level and was 7.4% below its level at the beginning of 2018. This was the worst performance of US share markets for any year since 2008, the peak of the international financial crisis.
For a US President who had repeatedly claimed that the performance of the US share markets was a key indicator of his economic success this was a serious setback. President Trump knows that easing of US-China trade tensions would be likely to lead to rises on US share markets – as the Wall Street Journal put it, losses on US share markets were ‘in part, because of concern that the trade fight between the U.S. and China could spin out of control.’ Following the President Trump-President Xi Jinping phone call there was a 0.9% rise in the US S&P500 share index on 31 December. Therefore, this attempt by President Trump to provide relief for the US share markets will have provided part of the background to the call.

No one who is not directly involved in the US-China trade negotiations knows all the factors involved so the following article is not intended to express any view on issues involved in these negotiations. However, it is designed to analyse accurately key pressures operating on the US side.
The test of two assessments of the dynamics of the US economy
An accurate assessment of the US economy is crucially importance for China in dealing with the Trump administration’s trade aggression, for the US economic situation affects not only its government and companies but also US domestic politics, thereby influencing overall US strength in the trade dispute.
Regarding this issue of the US economy during 2018 two sharply contradictory analyses were put forward in China. But the present sharp falls on US stock markets means it can be clearly judged which was correct.
- The analysis presented by the present author and others noted that economic growth in the US was weak by historical standards. It was shown in earlier articles that economic growth under Trump is the slowest under any US president since World War II, that is for over seventy years. In this context the US economy’s recovery in 2018 from its extremely slow growth in 2016 was therefore merely a purely normal, but historically weak, business cycle upturn which would therefore be followed in 2019/20 by an equally normal cyclical slowdown. Consequently, based on economic trends the domestic position of President Trump was at its peak in summer/autumn 2018 and would then weaken.
- The second analysis, in line with statements by the Trump administration, claimed that the US was undergoing very strong economic growth by historic standards. The chief evidence presented to back this claim, as it could not be supported by US economic growth data, was assertions regarding the US stock market – it was argued that the upswing of US share prices in summer 2018 indicated that the US was undergoing, and faced the prospect of, very rapid growth
This second analysis has suffered a decisive defeat with the severe falls on US share markets. The aim of this article is therefore:
- To show the full scale of the falls in US share prices and the reasons for them.
- To show that the reasons for these falls are easily explained by the real dynamics and slow growth of the US economy.
For a realistic estimate of the situation of the US economy, the facts show that it is necessary to definitively get rid of the entirely false presentation of ‘very rapid US growth’ and instead to understand that US actions are explained by US growth being very slow by historical standards. Some implications of this for the domestic political situation in the US and the dynamics of the ‘trade war’ are given – including the present turmoil in US domestic politics with the resignation of Defence Secretary Mattis, the de facto forced resignation of Trump’s Chief of Staff Kelly, the increasing series of convictions of Trump associates by US Special Counsel Mueller, and the shutdown of sections of the US government around Xmas 2018.
In such a serious matter, affecting the position of China in the trade dispute, with consequences for many countries, exaggeration in any direction is damaging – that is, there is no virtue in ‘optimism’, and no virtue in ‘pessimism’, there is only a virtue in realism. Therefore, a careful study of the real facts of the US economic and political situation is concentrated on here.
The S&P500
Starting with US share markets, the S&P500 is the most frequently cited share index of large US companies – the Dow Jones Industrial Average covers only 30 companies and the NASDAQ is highly biased towards technology shares. Therefore the S&P500’s dynamics will be analysed first – the movement of the S&P500 compared to its level at the beginning of 2018 is shown in Figure 1 (the first day of trading of US shares in 2018 was 2 January).
As may be seen, the performance of the S&P500 was not at all been strong during most of 2018 – on 8 May 2018 the S&P500 was still below its level on the first trading day of 2018. There was then a temporary rise during the summer until a sharp fall began after 20 September.
In short, the US share market fall, including the severe fall on 19 December, which attracted world attention, was not a sudden response to the particular Federal Reserve interest rate on that day but was rooted in weakness of US share prices throughout the year. Indeed, US share prices had already been falling for almost three months.
The summer rise in US share prices was therefore the exception and not the trend during 2018. The sharp falls in US share prices as the end of the year, by 31 December the S&P500 has fallen 14.5% from its peak level and was 7.0% below its level at the beginning of 2018, was therefore the culmination of a trend of weakness which had existed for most of the year.
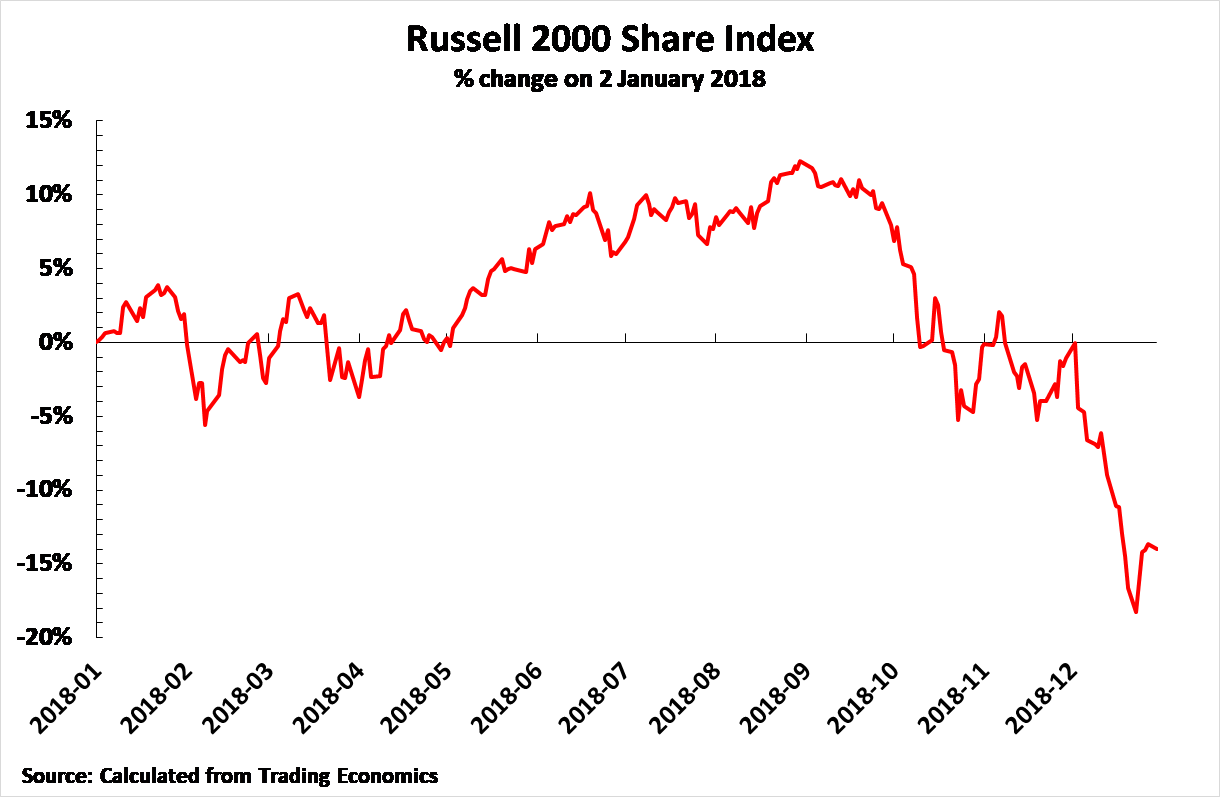
The Russell 2000
The S&P500 is the most widely followed US share price index but it is dominated by large US companies. Therefore, to show clearly the overall trend in US share markets, data will also be given for the Russell 2000 index – the best indicator of the share prices of US small companies as it includes 2000 smaller US firms. The changes in this index since the beginning of 2018 are shown in Figure 2. As may be seen its pattern is essentially similar to the S&P 500.
The Russell 2000 was still below its level at the beginning of 2018 on 5 May. It then began a rise during the summer and reached a peak on 31 August. By 31 December it had fallen to 14.0% below its level at the beginning of 2018 and 23.4% below its peak level.
In short, US small companies showed the same trend of weakness in share prices as large companies – but in an even more pronounced form.
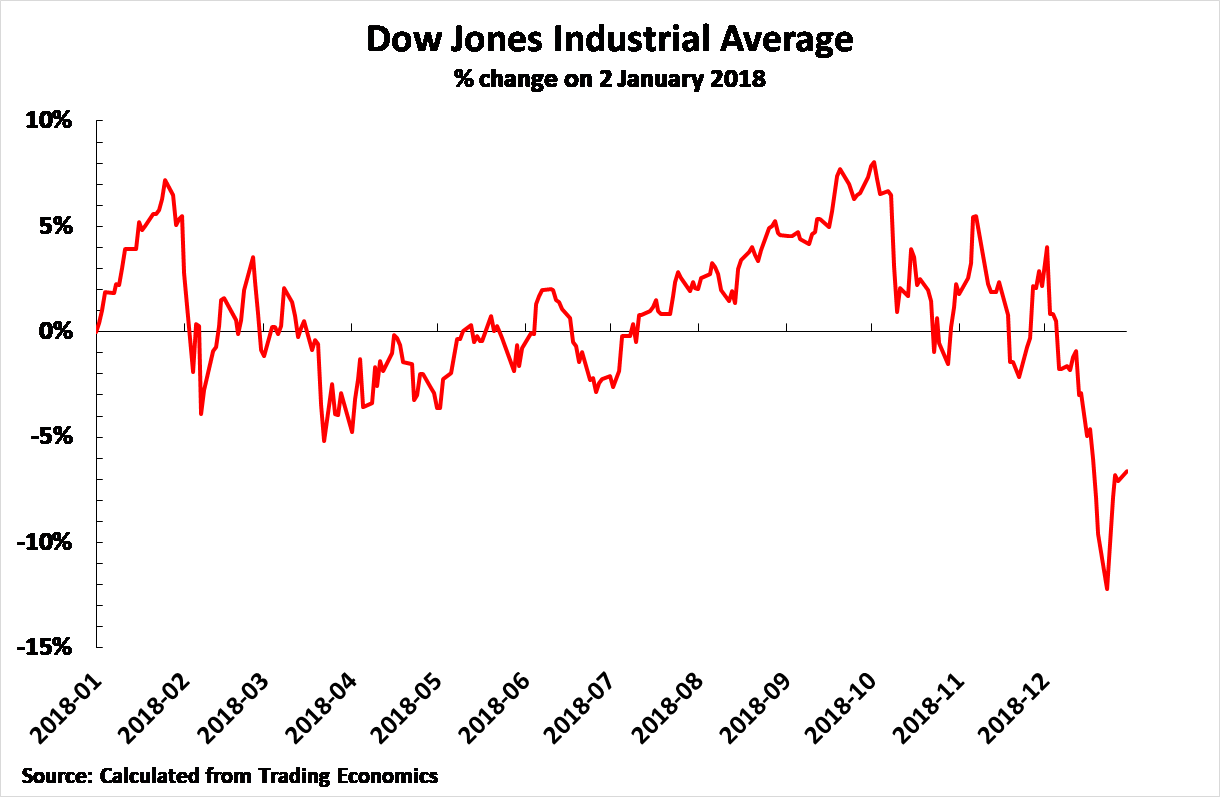
Dow Jones and NASDAQ
To complete the real picture of US share dynamics, data will also be given during 2018 for the two other widely quoted US share indexes – the Dow Jones and the NASDAQ.
Figure 3 confirms that the Dow Jones Industrial showed the same pattern as the S&P500 and the Russell 2000. The first part of 2018 chiefly showed weakness – on 5 June the Dow was still below its level at the beginning of the year. There was then a temporary upturn during the summer/early autumn with the Dow reaching its peak on 3 October. The Dow then began falling sharply – by 31 December the Dow was 6.6% below its level at the beginning of 2018 and 13.6% below its peak.
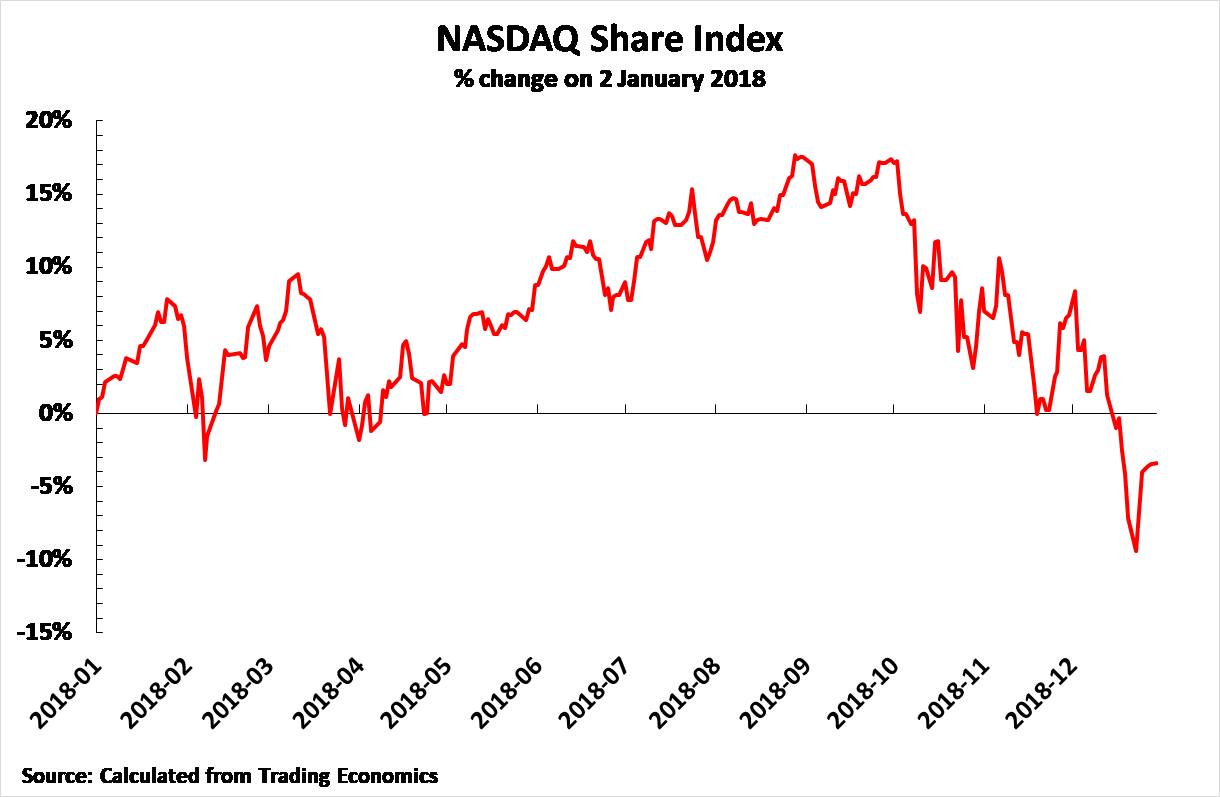
The heavily technology biased NASDAQ share index shows the same pattern as other US share indexes – with the exception that the performance of US high technology stocks was both somewhat better and more volatile than other large US companies. Figure 4 shows the performance of the NASDAQ during 2018.
The NASDAQ was still below its start of 2018 level on 24 April, but the mid-year rise in the index then began in the spring as opposed to the summer as seen in the other US share indexes. The NASDAQ peaked on 29 August. By 31 December the NASDAQ was 3.4% below its level at the beginning of 2018 and 17.9% below its peak.
Summary of US share price movements
The overall dynamics of US share markets in 2018 are therefore clear. The share price increases in mid-2018, on which attention was focussed by sections of the Chinese media at that time, were a purely temporary phenomenon and not typical of the year as a whole. On the contrary, the chief feature of 2018 was weakness in US share prices. As the situation on US share markets was summarised by Ian Bremmer, president of the Eurasia Group, the pre-eminent US ‘risk analysis’ company on 18 December: ‘S&P down 4.8% for the year. If the market doesn’t recover, this will be Wall Street’s worst year since the 2008 financial crisis. Dow and S&P also down 7% this month – on pace for their worst Decembers since the Great Depression.’
In summary those in the Chinese media claiming that the performance of US shares in 2018 predicted strong US growth were not merely wrong in terms of the actual dynamics of the US economy, but they were also wrong in terms of the real dynamics of US share markets in 2018. US share markets were badly performing, not well performing, during 2018.
The US business cycle
Before analysing the relation between movements in US share prices and trend in the US productive economy it is necessary to establish the real trends in the latter.
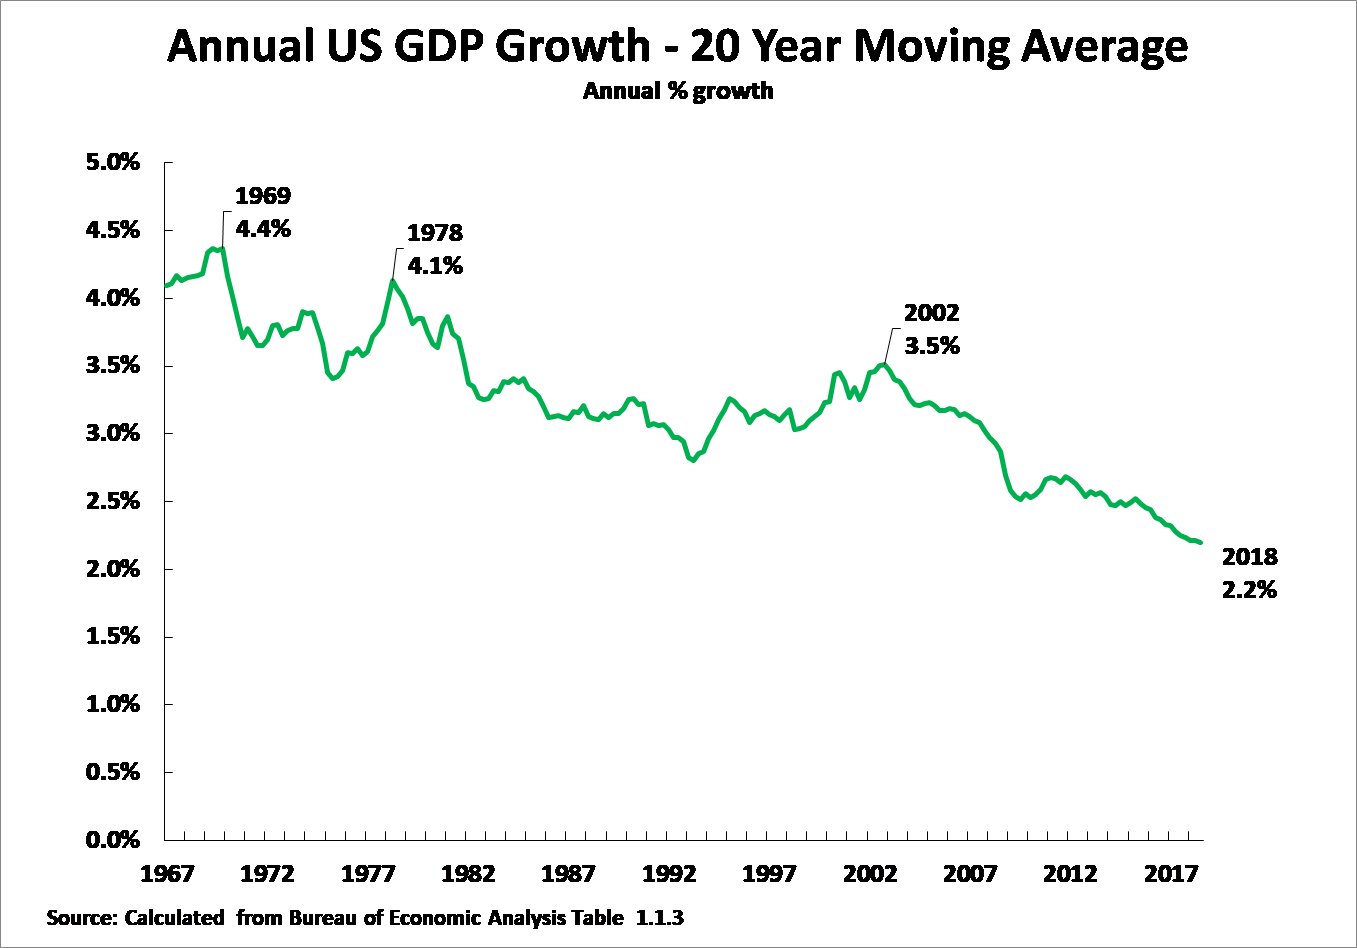
Figure 5 show clearly that the fundamental long term trend in the US economy is its slowdown – a process which has been taking place for fifty years. This removes all claims of ‘rapid growth’ under Trump in the US economy.
Taking a 20-year moving average, to remove all short-term business cycle fluctuations, peak US annual average GDP growth was:
- 4% in 1969.
- 1% in 1978
- 5% in 2002.
- 2% in 2018.
In summary, in the last half century US annual average economic growth has halved.
US business cycles
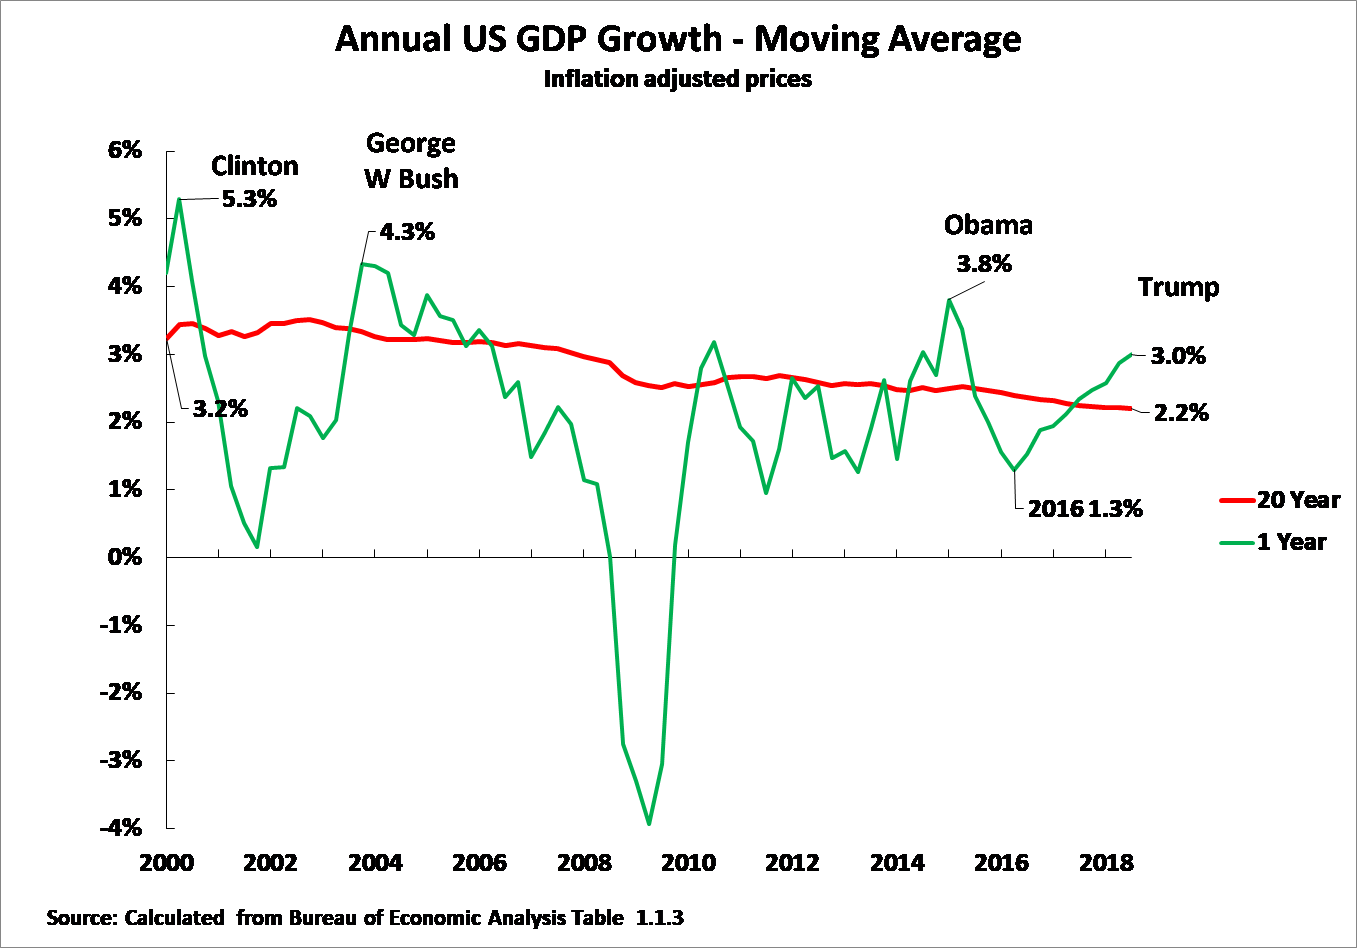
This slowing of the US economy, of course, does not eliminate business cycles – cyclical upturns and downturns simply occur over and above this slowing average US growth rate. This process, for the 21st century, is shown in Figure 6.
The key recent feature of the present US business cycle was the very severe slowdown of the US economy during 2016 – with annual year on year growth falling to 1.3% in the second quarter of that year. This extremely slow growth, very significantly below the annual average US growth of 2.2%, undoubtedly aided the election of President Trump in that year.
As in 2016 US growth was far below its long-term average it would be expected that the US economy would therefore make a cyclical turn upwards. Figure 6 confirms that this duly occurred, with US year on year growth rising to 3.0% in the 3rd quarter of 2018. The upturn in the US economy in 2018 was therefore a perfectly normal cyclical fluctuation.
A normal cyclical upturn
Even a simple but basic calculation confirms that the US economic upturn during 2018 was merely a normal cyclical fluctuation and not any serious acceleration in US medium/long term growth. The 1.3% US growth rate reached during 2016 was 0.9% below the 20-year moving average US annual average growth rate of 2.2%. Therefore, merely to maintain that long-term average, it would be expected that the US growth rate would rise to 0.9% above its average level – that is to 3.1%. Only a move significantly above that 3.1% level would indicate an acceleration in US growth. However, the peak year on year growth under Trump, 3.0% in the 3rd quarter of 2018, was therefore not at all outside the range that would be expected from a normal business cycle fluctuation – indeed it might be expected that the US economy might accelerate slightly faster without this indicating that anything more than a normal business cycle was taking place.
In summary, there is no evidence whatever that rapid growth was taking place under Trump, all that was occurring was a perfectly normal business cycle recovery from the very poor performance of the US economy in 2016.
Figure 6 furthermore shows that peak growth under Trump is not notable for how fast it is but, on the contrary, how slow it is. All three of the previous US presidents in the 21st century had faster peak growth than Trump – compared to Trump’s peak growth of 3.0%, peak year on year GDP growth under Obama reached 3.8%, under George W Bush 4.3%, and under Clinton 5.3%.
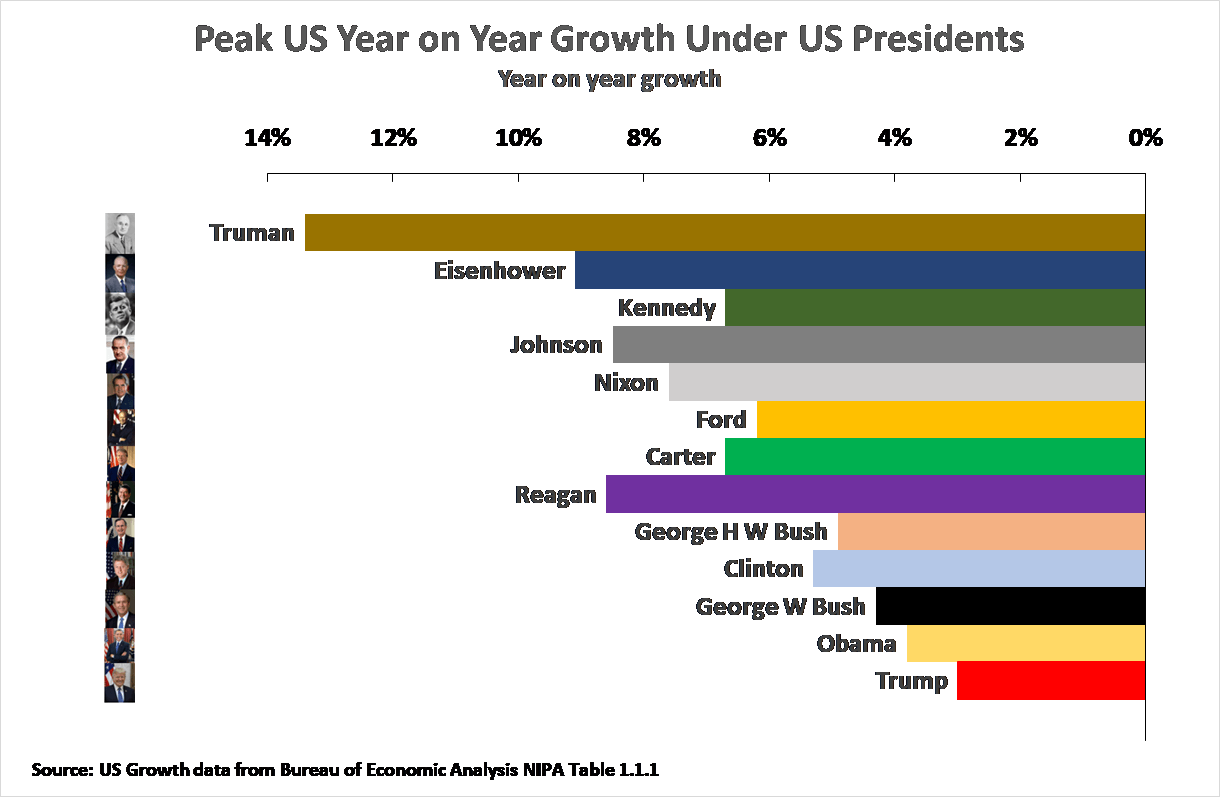
Even more fundamentally, peak economic growth under Trump is the lowest under any US President since World War II – that is in a more than seventy-year period. This comparison of growth under US presidents is shown in Figure 7. Peak growth under Trump of 3.0% was not merely lower than under US 21st century presidents Obama, George W Bush, and Clinton but Trump’s peak growth rate was far lower than under George H W Bush (4.4%), Ford (6.2%), Carter (6.7%), Nixon (7.6%), Kennedy (also 7.6%), Johnson (8.5%), Reagan (8.6%), Eisenhower (9.1%), and Truman (13.4%).
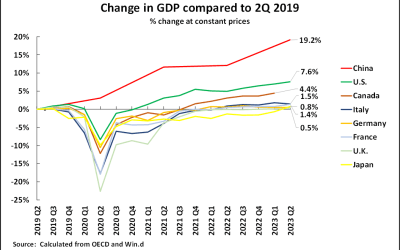
IMF projections of US economic growth
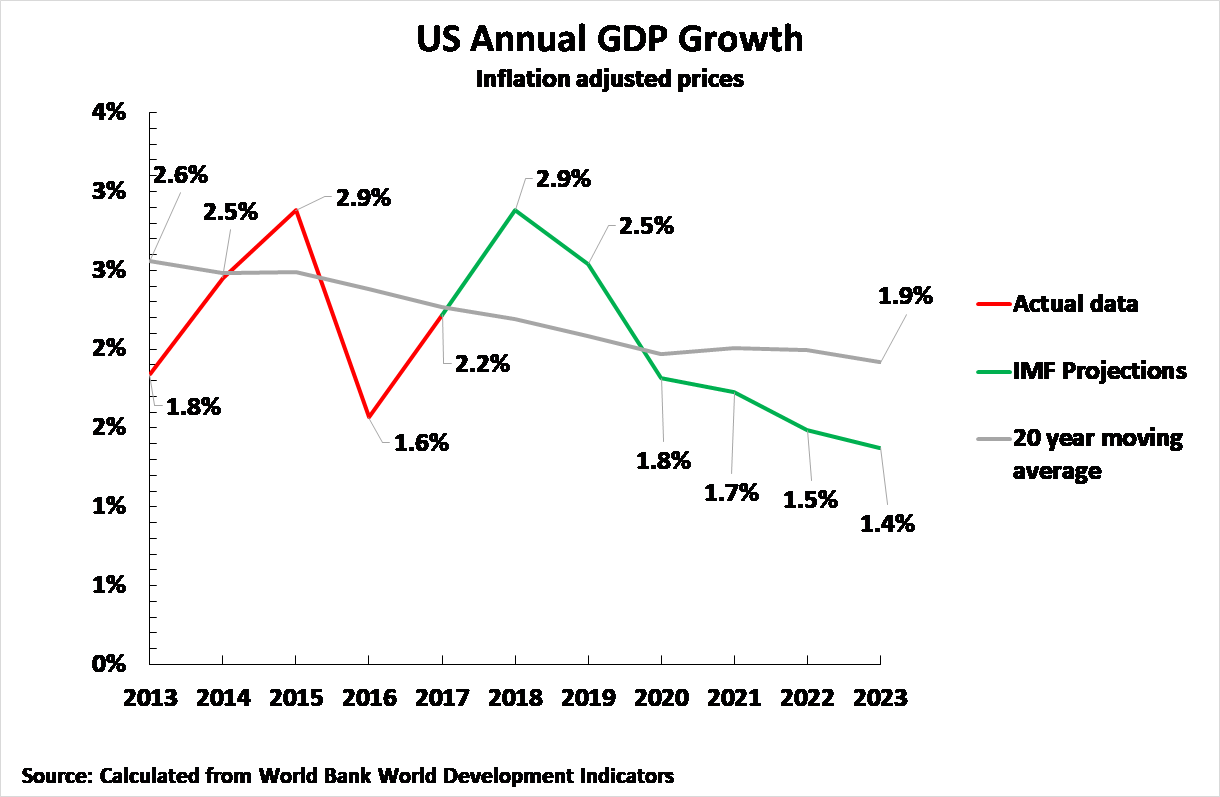
This analysis of the dynamics of the US economy from its fundamental features, that the US economic recovery in 2018 is merely a normal upturn in the US business cycle, which will therefore be followed by a slowdown in 2019/2020, is also confirmed by the analysis of the IMF. Figure 8 therefore shows the projections of the IMF for the US economy after 2018. This indicates US growth slowing from a cyclical peak of 2.9% in 2018 to 2.5% in 2019, 1.8% in 2020, and only 1.4% by 2023.
In summary, during 2018 President Trump was benefitting from a purely normal but historically weak upturn in the US economy. This will, therefore, equally be followed by a cyclical slowdown in 2019/2020.
Share prices
Turning to analysing the relation between the trends in US share prices and the shifts in the US productive economy it may, unfortunately, be noted that one of the weakest features of analysis of share price movements in some sections of the Chinese media is that it is does not distinguish between long term trends and cyclical movements in share prices. More precisely factual studies show that:
- In cyclical terms, upward movements of share prices are positively correlated with economic growth – that is, in terms of the business cycle, an increase in share prices is correlated with faster economic growth of the productive economy and slower growing or falling share prices is correlated with slower economic growth or recession in the productive economy.
- Over the long term, all major factual studies show a negative correlation between share prices and economic growth, that is the faster the increase in share prices the lower the rate of economic growth – for the standard Western studies on these, which are unfortunately insufficiently known in China, readers are recommended to Dimson, Marsh and Staunton’s Triumph of the Optimists or Ritter’s Economic Growth and Equity Returns.
However, in the present study, cyclical movements in the US economy are being analysed, therefore it would be expected there would be a positive correlation between US share price movements and growth of the US productive economy i.e. faster rising share prices would be expected to be correlated with faster US economic growth, and slower rising, or falling, US share prices would be correlated with slower US economic growth. This expectation is in line with factual data on the US economy.
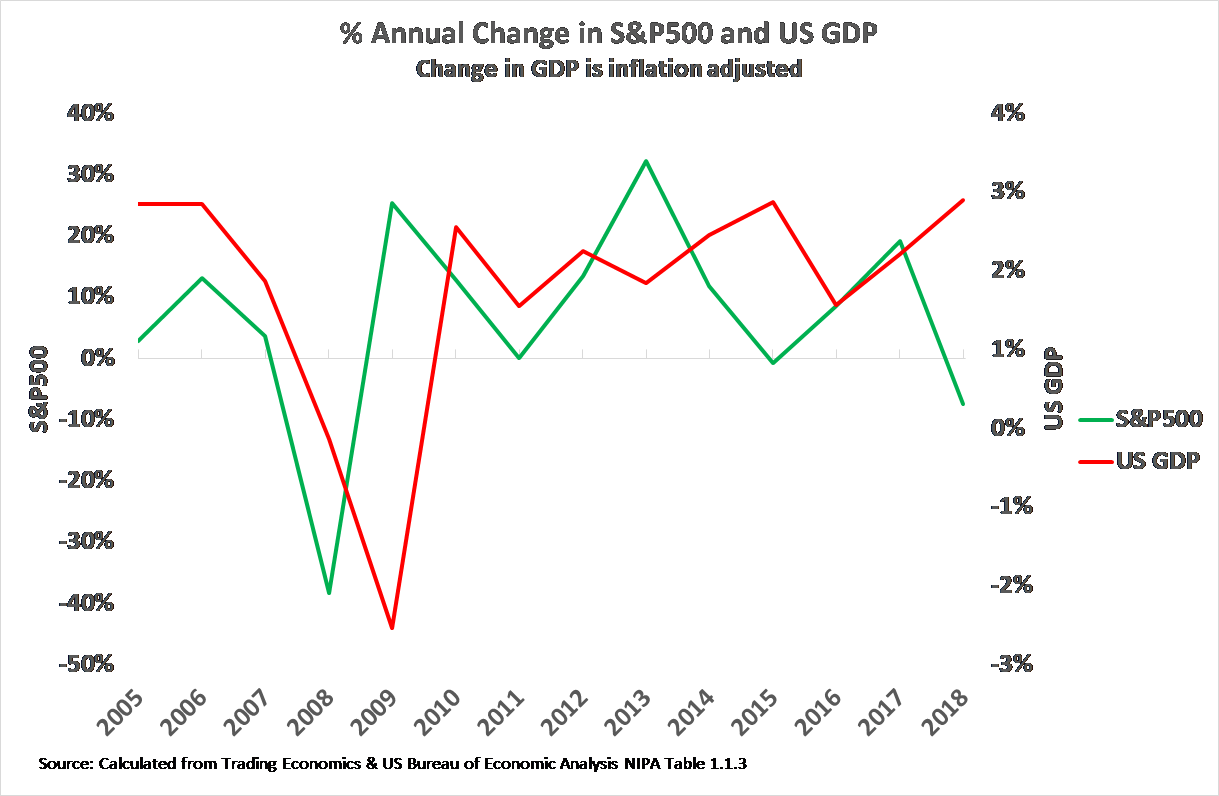
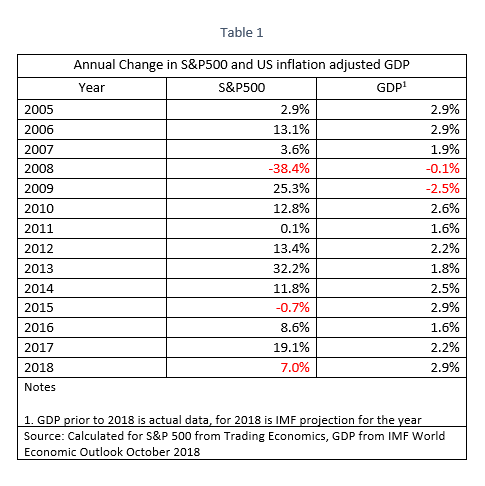
More precisely, Figure 9 and Table 1 confirm that shifts in US share prices are a leading indicator of changes in the US productive economy – that is, shifts in share prices tend to precede changes in the US productive economy. Thus, taking recent business cycle shifts:
- The downward shift in US share prices in 2007 preceded and predicted the fall in US GDP in 2008/2009.
- The upward shift in US share prices in 2009 preceded the upturn in the US economy in 2010.
- The downward turn in US share prices in 2015 preceded the downturn in in the US productive economy in 2016.
- The upward shift in US share prices in 2016 preceded the upturn in the US economy in 2017/2018.
In that context, of course, the downturn in US share prices in 2018 is entirely consistent with, and would predict, a slowing US economy in 2019 – as indicated by both the fundamental features of the US business cycle and the projections of the IMF.
Dynamics of the US economy
To summarise the above, it may be seen that it was already possible from the fundamental dynamics of the US economy, to foresee both that there would be a purely normal cyclical upturn of the US economy in 2018, that there would be a slowdown of the US economy in 2019/2020, and that US economic growth under Trump would be slow by US historical standards. The only piece of evidence that those predicting historically ‘fast’ US growth under Trump usually presented was the rise in US share prices. This rise in US share prices, however, in 2018 went sharply into reverse, thereby destroying the sole significant piece of evidence for those claiming that US growth was ‘very strong’. But this shift, as seen, was merely that changes in US share prices played their role as a leading indicator for the US productive economy – i.e. the downturn in US share prices at the end of 2018 was merely indicating a slowdown in the US productive economy in 2019/2020.
In summary, fundamental economic analysis of the US economy has always shown that:
- US growth under Trump was slow by historical standards
- That the US economic upturn in 2018 was merely a normal cyclical upturn, not a sign of new strong growth, and would therefore be followed by a cyclical downturn in 2019/2020.
Implications for Trump
In order to assess the impact of these economic trends on the Trump administration it is necessary to have an accurate baseline for assessing Trump’s political support.
The starting point is that the claims repeated in some sections of the Chinese media that Trump is popular has no basis in fact – it is merely propaganda by the Trump administration which serious media should therefore not repeat.
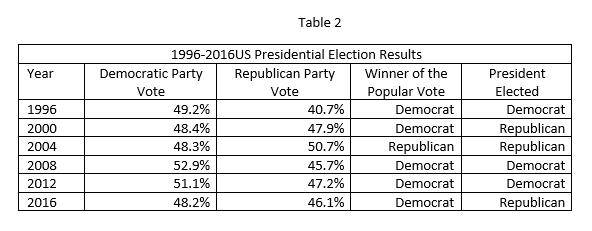
Most recently, the US midterm Congressional elections confirmed, as the 2016 presidential election had demonstrated before, that Trump is unable to win a majority in the popular vote and is only in office due to the non-democratic character of the US electoral system. Both the 2016 and 2018 elections confirmed that the majority of the US population is opposed to Trump.
Taking first the 2018 midterm Congressional elections, the Democrats defeated the Republicans in the popular vote by seven percent. This followed from the 2016 Presidential election when Clinton defeated Trump by almost three million, or slightly over two percent, in the popular vote – see Table 2. As may be seen the Republicans have been defeated in the popular vote in five out of the six last Presidential elections.
Can Trump successfully continue to use the non-democratic character of the US constitution?
Analysing the trends in the popular vote the serious question about US domestic politics is therefore not why Trump is popular, because the facts show that he is not popular, but whether Trump can continue to use the non-democratic character of the US constitution to remain in office? The key starting point for analysing this is that in 2016, even with the non-democratic US electoral system, Trump only won his majority in the Electoral College by a tiny margin. Essentially Trump’s lead of only 107,000 votes in the three states of Michigan, Wisconsin and Pennsylvania delivered enough votes in the electoral college to allow him to become President. Equally, therefore, only an extremely small shift against Trump in 2020 would remove him from office. In the midterm elections it is therefore significant that the Democrats won the Senate races not only in the key states of Michigan, Wisconsin and Pennsylvania but also in other ‘swing’ states such as Minnesota, Ohio, and Virginia.
This political situation in turn clearly interrelates with the situation of the US business cycle already analysed. In 2016 Trump gained from the extremely bad performance of the US economy during that year, which turned public opinion against the Democrats who held the Presidency. But despite this favourable economic situation for his candidacy Trump was defeated in the popular vote. In 2018, despite the mid-term elections being held near the peak of the upturn of the US business cycle, the Trump Republicans were decisively defeated in the popular vote.
In summary, in both extremely favourable economic situations for Trump he was defeated in the popular vote. The conclusion of this is clear. In a two-party Democrat-Republican contest the evidence is that Trump will lose the popular vote even in favourable economic conditions. But by 2020, the year of the next presidential election, the US economy, due to normal processes in the business cycle, will have slowed considerably creating a less favourable situation for Trump. As Trump, even in the favourable economic conditions for him of 2016, was only just able by a small margin of 107,000 votes to utilise the non-democratic features of the US constitution to attain office it is improbable that in the less favourable economic conditions of 2020 such a small margin would not be overturned. Therefore, Trump’s only serious chance of retaining office is either to be able to use the non-democratic features of the US constitution or of an intervention to disrupt the US two party political system by running of a serious ‘third party’ candidate. In short, based on the trends in the popular vote and the business cycle, it is improbable that Trump will win the 2020 Presidential election – the other possibility for him to retain office, a significant ‘third party’ candidate running in 20120 is considered below.
The political weakening of Trump
Turning from the baseline of Trump’s political support to the impact on this of the slowing of the US economy, and the fall of US share prices from their summer 2018 levels, there is no doubt that the trends in the US share market, by demolishing the flimsy evidence that the US economy was undergoing strong growth, have had a deep effect both on the Trump administration and on Trump’s personal prospects for re-election. This is not merely an objective process but is well understood in the most serious Western media.
Thus, as the New York Times noted: ‘President Trump has unabashedly hitched his political fortunes to a rising stock market….
‘But the volatile stock market, which just posted its worst week since 2008, is falling in part because of Mr. Trump’s own policies, including an escalating trade war with China, a shutdown of the federal government and the fading effects of the $1.5 trillion tax cut Mr. Trump ushered in at the end of 2017…. Investors… seem to have a darker view of economic growth than the central bank does.’
The Washington Post noted the same trends in an analysis worth citing at length:
’President Trump has kept an almost obsessive watch on the stock market as it has lurched lower in recent weeks, tuning in to Fox Business and checking in with Lou Dobbs, a host on the network.
‘The president has complained to aides about… growing unease about an economic slowdown in the months to come…
‘The lower the market drops, the more the president worries that he is losing his most potent argument for reelection, several of the officials said.
‘Unless a miracle “Santa Claus rally” emerges, this is going to be the worst year for U.S. stocks since 2008.
‘Since the 2016 election, Trump has pointed to market gains as proof that his economic policies are working and that the country is thriving under his leadership. Now a favored talking point is crumbling.
‘Before the market downturn, Trump would take prepared remarks and add comments about the economy, officials say. But lately he has tweeted less about the economy.
‘The Dow’s performance since Trump took office is now significantly less than what was achieved at the same point in Barack Obama’s presidency. The Dow is up 18 percent under Trump, compared with 45 percent at this point under Obama…
‘“The market has lost confidence in the narrative coming out of the White House on the economy and trade,” said Joseph Brusuelas, chief economist at RSM, a multinational network of accounting firms.
‘But the big sell-off this month was triggered when investors realized that the president had oversold his trade truce with China. Trump’s claims that China had agreed to reduce its tariffs on cars to zero and cut the U.S.-China trade deficit were never substantiated…
‘‘“The president may get the “art of the deal,” but the art of the sale is to under-promise and over-deliver,” said Michael K. Farr, president of investment firm Farr, Miller and Washington. “U.S. investors understand they have to raise the verify part of the ‘trust but verify’ equation. Frustration is building.”
‘White House officials say Trump’s rhetoric on China, particularly the tweet describing himself as “Tariff Man,” rattled the confidence of U.S. investors and business leaders and caused the Dow to shed more than 1,100 points in a week.
‘The Dow and S&P 500 are expected to notch their worst December performances since 1931, a sign of how rapidly Wall Street sentiment is shifting on the businessman president and his ability to steer the economy.
‘And just as the market seemed to stabilize, Trump and top Democratic leaders engaged in an Oval Office dust-up over border security that was broadcast live, raising fears of a government shutdown and of stalemate in Washington over the next two years.’
‘The lower the market drops, the more the president worries that he is losing his most potent argument for re-election, several of the officials said.’
Political weakening of Trump
This economic weakening of Trump necessarily has the consequence of undermining his political position. This trend is well understood by the Western media. For example, the Financial Times analysed in an editorial even before the very sharp falls on US share markets at the end of the year:
‘As recently as October, Donald Trump was in reasonable political shape for an incumbent US president…. Two months on, and the president is encircled by troubles. The midterms cost him the House of Representatives. John Kelly, his chief of staff, the bringer of (some) order to an anarchic White House, is off… And Mr Mueller’s Russia investigation, which touches on other matters, has resumed with some force. The jailing of Michael Cohen for political and finance violations brings the probe to the door of Mr Trump, his former legal client. The president’s first national security adviser, Michael Flynn, has also co-operated with Mr Mueller. Mr Trump has become dangerous to know… In Washington, where locals have a damp finger in the air at all times, the better to gauge a change in the wind, there is a small but perceptible distancing from the president by some in his own party… Nor is it so obvious any more to Republicans that Mr Trump is a winner. Their House losses in November were severe, despite his assiduous campaigning. He has made no overture to voters who did not back him in 2016. Given changing demographics, and the narrowness of its presidential victories in recent decades, at some point the GOP must broaden its appeal. Hope that Mr Trump would build a new coalition is fading.’
The Financial Times is not merely one of the most important and serious Western media outlets but it is not merely a resolute defender of the capitalist system but a strong supporter of the US – including in its disputes with China. Therefore, that such a major media outlet, which is biased in favour of the US and against China, estimates that the position of Trump is weakening is highly significant.
Summary
To summarise, an objective analysis of the situation of the US economy and the Trump administration therefore reveals the following:
- With the very sharp falls on US share markets, the only fact that those claiming the US was undergoing ‘strong growth’ has disintegrated – clarifying and confirming the situation that peak US growth under Trump is slow, indeed the lowest under any US president since World War II.
- As US share markets are a leading indicator of trends in the US productive economy the recent sharp falls in US stock markets confirm that there will be a normal business cycle slowdown in the US economy in 2019/2020 – following after the normal business cycle upturn in 2018. This does not indicate that there will be recession in 2019-2020, but merely that the US economy will grow more slowly than in 2018.
- Even under favourable economic conditions in 2016 and 2018 Trump was defeated in the popular vote. As in 2020, at the time of the next presidential election, economic conditions for Trump in the will be less favourable than in either 2016 or 2018 it is improbable that Trump can win the popular vote in 2020 in a straightforward two party Republican-Democrat contest
- Due to the non-democratic character of the US constitution it is possible for a candidate to be elected president despite being defeated in the popular votes. However, Trump’s margin in 2016, when he was successful using this method, was so thin that even a very small decline in his popularity would result in his losing the Presidential election in 2020 – if it is a straightforward Democrat vs Republican contest.
- Regarding the possibility of a significant ‘third party’ intervention in 2020, with the aim of reducing the Democrat vote and allowing Trump to remain in office, this is certainly technically possible – under the US political system, in which money plays a decisive role, the entry of a billionaire who can finance their own campaign, such as former New York Mayor Michael Bloomberg, into the Presidential race is always possible. This would be similar, although for a different party, than in the 1992 Presidential election when the entry into the race of billionaire Ross Perot split the Republican vote and delivered the election to Democrat Bill Clinton. But Bloomberg appears at present to be more interested in winning the Democratic Party nomination and would obviously be aware that a ‘third party’ candidate has almost no chance of being elected president – it is consequently unclear whether any such significant figure would be prepared to play the role of simply attempting to split the Democrat vote to allow Trump to remain in office while themselves personally having no chance of winning the presidency.
The interaction of these economic and political trends with the Trump administration’s trade aggression against China is of course not simple and numerous facts are known only to those involved in the negotiations. Therefore, no direct conclusions for the US-China trade dispute would be drawn by the present author from the above facts. But ‘seek truth from facts’ is not merely one of China’s most famous and accurate sayings, and crucial to deal with the Trump administration’s trade aggression, but it is simultaneously one of the most disregarded by some sections of Chinese media – who prefer to replace it with ‘seek truth from the new article in the US press’ or even ‘seek truth from the latest false propaganda press release by the Trump administration’. Such methods not only violate any rules of serious journalism but are damaging both in policy terms and financially – it would obviously lead to error for China to make policy on the basis of inaccurate information, while companies and individual will lose money if they act on the basis of it.
What has occurred with the sharp US share price falls at the end of 2018 is merely a demonstration that reality is more powerful than propaganda, that the actual situation of the US economy has become more transparent – thereby taking by surprise those who have followed the propaganda.
It is, of course, too early to adopt a definitive prediction regarding the chances of Trump’s re-election in 2020, and ‘surprise’ interventions such as the entry of a third-party candidate cannot be excluded. But reduced to essentials at present the indicators are not favourable for Trump’s election due to:
- The normal downturn/slowdown of the US business cycle in 2019-2020.
- The undermining of Trump by the sharp falls in US share markets at the end of 2018 which confirm the slowdown of the US economy in 2019-2020.
- The inability of Trump to win the popular vote even in the favourable economic situation for him of 2016 and 2018 – and the fact that he will face less favourable economic conditions in 2020.
Both the economic and political dimensions of this situation are of course significant for China in dealing with the present US tariff war against China.
Related articles

We have entered the “China period of the development of socialism” – Preface to the European edition of “China’s Great Road”

The ‘Belt & Road’ region will be the main locomotive of the world economy

Why the Latin American left, & the left in other countries, need to study China’s economic success
The news is full of headlines about ‘China’s economic collapse’ — ignore them