
Blog | 05 Mar 2018
The US trade deficit is ‘Made in the USA’ not ‘Made in China’

China’s tactical response to the US administration’s arbitrary proposed tariffs against China, as well as unjustified US official and unofficial sanctions against Chinese companies such as ZTE and Huawei, must take many factors into account. Some of these can be known only to those directly involved in negotiations. Therefore, the following analysis is not intended to deal with any tactical issue in US-China trade relations. It only deals with one fundamental underlying aspect of the situation – showing that the US’s trade deficit with China is clearly due to US domestic policy and not to China. The facts show clearly the US trade deficit is ‘made in the USA’ and not ‘made in China’.
When did the US trade deficit develop?
The clearest way to see that the US trade deficit is due to US domestic policy, and cannot possibly be a product of China, is to look at the historical development of the US trade balance. This data shows clearly that the US balance of payments began to deteriorate, due to declining US international competitiveness, long before China had achieved a significant position in international trade.
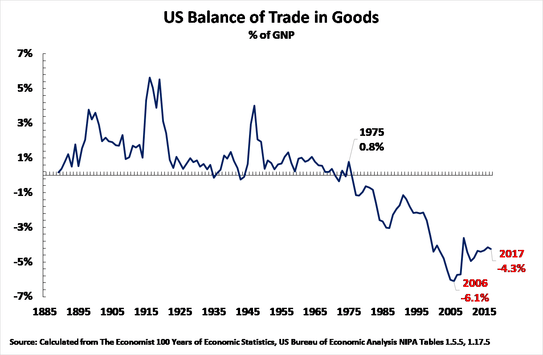
Starting with analysing the US balance of trade in goods, the largest sector of international trade, this is shown in Figure 1. As is clear, for almost a century from 1889 (the earliest year for which there is internationally comparable data) up to the 1970s, the US had a virtually continuous balance of goods trade surplus. This surplus was significant in peacetime, around or above 1% of GNP, and reached far higher levels during World Wars I & II. Adding up annual surpluses and (few) deficits the US balance of trade surplus in 1889-1975 was cumulatively equivalent to a surplus of equal to 64%, almost two thirds, of US GNP. This shows the strong competitivity of US trade in goods throughout this entire period up to the 1970s.
To summarise the overall position, from the end of the 1880s until the 1970s the US was in a surplus on trade in goods almost every year and with an overwhelmingly positive cumulative balance.
China cannot have been responsible for worsening US international competitiveness
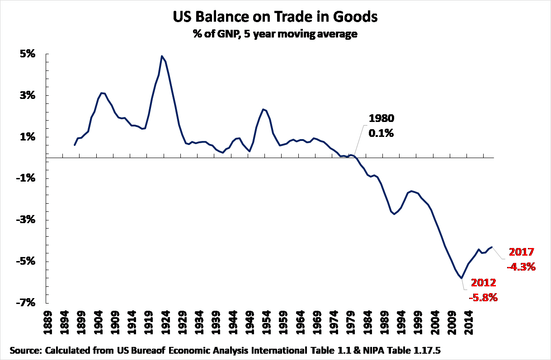
The above data immediately makes clear that it cannot possibly be China that was responsible for the deterioration of the US balance of trade deficit. In the early/mid 1970s, when the US balance of goods trade began to move into sustained deficit, China had not even launched reform and opening up. China’s share both in world GDP and in world trade at that time was extremely low – in 1978 China accounted for a mere 0.5% of world exports of goods and services, and in 1982, the earliest World Bank data, it accounted for 1.1% of world goods exports. In summary, China was an extremely small factor in world trade at the beginning of the 1980s, when the US began to move into a large deficit in world trade in goods, and therefore it cannot be China that is responsible for the US trade deficit.
From the beginning of the 1970s there was, therefore, a fundamental worsening of US competitiveness in goods trade – with the US position deteriorating very seriously from the 1980s onwards. In summary, the deterioration in the US balance of trade in goods, that is the loss of US competitiveness in goods trade, was due to an overall worsening of the US competitive position in international trade – it was not due to China.
The deteriorating overall competitiveness of the US economy
So far only international goods trade has been analysed. While this is the largest part of international trade it is not the only one. In theory it is possible that the US long-term worsening deficit in goods trade could be offset by increasing US competitiveness in other sectors of international transactions. Indeed, factually, the US has run a persistent surplus on its trade in services, and also a surplus on income from US investments overseas compared to income paid to other countries from their investments in the US. Given that dollar income from services or foreign investment is equally as valuable as income from goods exports it is necessary to evaluate the relative importance of these different sectors of international interactions in assessing the overall global competitiveness of the US economy.
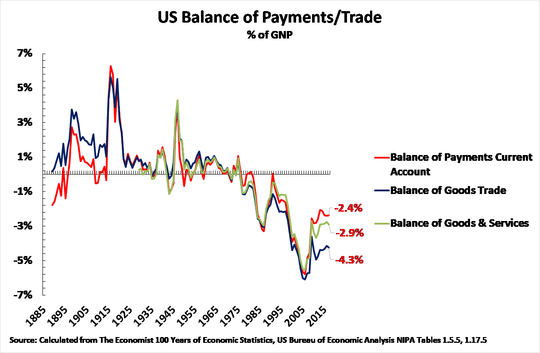
To analyse this, Figure 3 therefore shows the three main measures of the US economy’s international position – trade in goods, trade in goods and services, and the total US balance of payments on current account (i.e. including net income from investments in addition to trade). Figure 3 confirms, as would be expected, that the US deficit including services and investment income is is lower than its deficit on goods trade alone – the US balance of payments deficit of payments was 2.4% of GNP, the deficit on trade in goods and services was 2.9% of GNP, and the deficit on trade in goods was 4.3% of GNP.
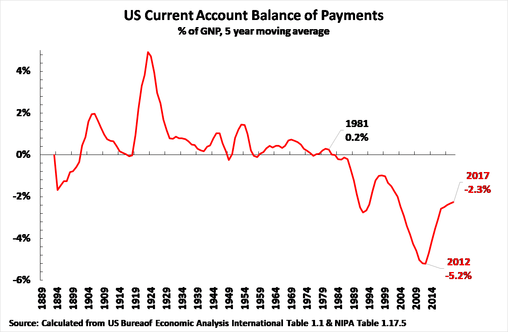
But Figure 3 also confirms that the US surplus on trade in services and on investment income was quite insufficient to offset the US deep deficit on trade in goods. Once again, analysing both the US combined trade in goods and services, and the US total current account of the balance of payments, the US was in surplus until the 1970s. After that, and in particular from the 1980s onwards, the US plunged into increasing deficit i.e. the overall international competitiveness of the US, taking into account all sectors of its international transactions, severely deteriorated from the beginning of the 1980s.
For reasons already given this data again confirms clearly that the severe worsening of the US overall balance of payments cannot possibly have been due to China. In 1981 China accounted for only 0.8% of US goods imports, and China’s exports of goods and services were only 0.6% of the world total. What the data shows clearly, instead, is that from the 1980s onwards a general sharp decline of US international competitiveness took place which had nothing to do with China.
This overall decline of the competitiveness of the US economy has a simple but inevitable arithmetical consequence. As the overall US deficit becomes larger, reflecting the decline in US competitiveness, then if the deficits with individual countries and regions stays exactly the same as a proportion of the overall US deficit the deficit with individual regions and countries will necessary increase in size – both in dollar terms and as a percentage of US GNP. This merely reflects the fact that the general competitiveness of the US economy was declining and has nothing to do with so called economic ‘aggression’ by other countries – both of East Asia in general and China specifically.Justin Yifu Lin has analysed in detail the consequences of this fact for China-US relations in several papers – including his article ‘High Tariffs on Chinese Imports Would Weaken America’ and his presentation on ‘Trump Economics and China-US trade imbalances’. As Lin noted:‘The increase in China’s trade surplus with the US since 1985 has been driven primarily by the evolution of the East Asian economy. As its wage levels rose, the US began importing consumer goods from Japan; then it shifted to importing these goods from the four “Asian tigers” – Hong Kong, Singapore, South Korea, and Taiwan – before finally sourcing most of these imports from China.’
The following analysis, therefore, in the context of the long-term deterioration of the US’s international competitiveness noted above, therefore adds detail and further confirmation to this analysis made by Lin.
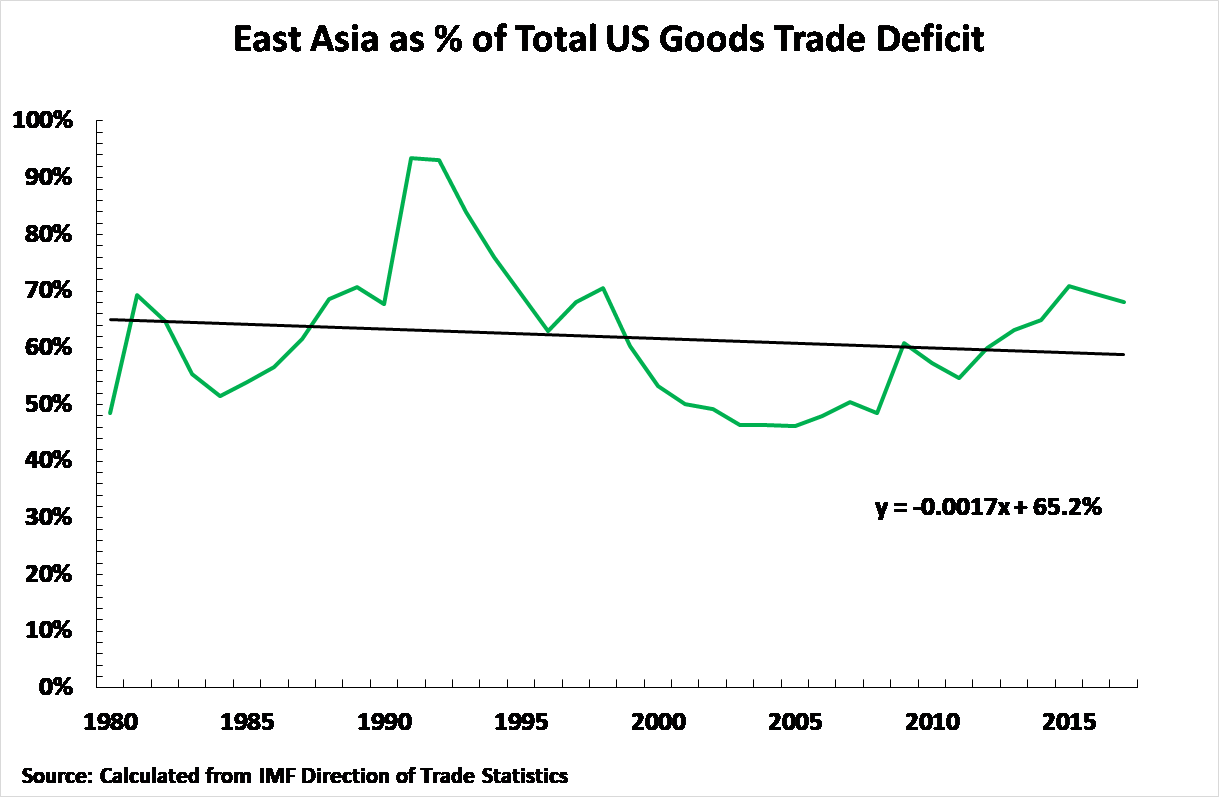
To do this Figure 5 shows data for the same trend analysed in constant price terms for the US by Lin, but taken from the IMF’s Direction of Trade Statistics and calculated in current prices. As shown by the trendline there has been no overall increase in the share of East Asia in the US balance of trade deficit in the entire period since 1980 – East Asia is defined here as Mainland China, Japan, the four Asian Tigers (South Korea, Singapore, Taiwan Province of China, Hong Kong Special Administrative Region), and ASEAN members.
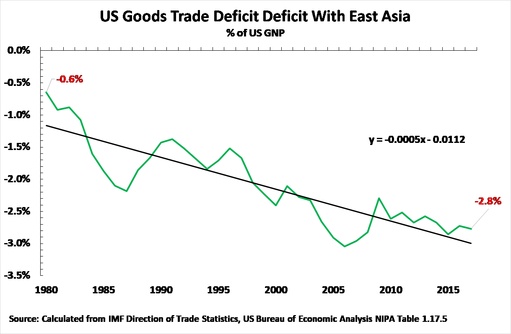
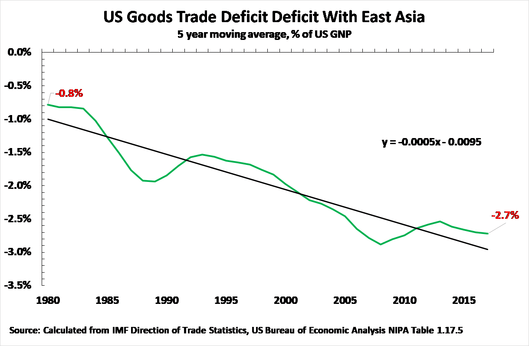
But a constant share of East Asia of a US balance of an overall US trade deficit which has been widening necessarily means that the size of the US deficit with East Asia has been increasing – not due to economic ‘aggression’ by East Asia but merely because the overall international competitiveness of the US economy has been worsening.
This also has a clear consequence. As Lin notes:
‘US consumers will bear the costs of the Trump administration’s tariffs on Chinese imports. US consumer demand for daily necessities will not change simply by raising the costs of imported products. The US will either continue to import from China, with its consumers paying more, or it will import from Vietnam, India, and Africa. However, because prices of goods from these economies are higher, a shift in US imports would cut the bilateral deficit with China, but cause its deficits with these countries to rise. The result, therefore, is the same: the US consumer would pay more for the same products.’
In short, any US attack on China in trade will be paid for by reduced living standards of US consumers, that is the US population.
Conclusion
Finally, there is no space in this article to analyse in detail the reasons for the long worsening of the US balance of trade position since the 1970s which has been factually demonstrated. Here only the most fundamental economic process can be analysed, and its geopolitical consequences noted.
In terms of the most basic economic processes producing the US balance of payments deficit the reason for this was analysed precisely by IMF Managing Director Christine Lagarde. She noted, if there is a balance of payments deficit this ‘imbalance is driven by the fact that a country spends above its income.’ (In technical economic terms a country’s balance of payments deficit is exactly equal to its shortfall of savings compared to investment).
To understand the underlying economic reasons for this situation whereby the US is spending more than its income it is useful to recall the Nazi leader Herman Goring famous declaration that it was necessary for Germany to choose between ‘guns and butter’ and that he preferred guns: ‘guns will make us powerful; butter will only make us fat’. Using this comparison, the US balance of payments deficit, the US ‘spending above its income’, is simply caused by the fact that the US is trying to have both ‘guns and butter’ – but cannot afford both simultaneously.
The US spending above its income derives from the fact that it attempts to maintain very great military expenditures, by far the world’s largest, while simultaneously trying to avoid even worse domestic political discontent than currently exists by avoiding even more severe pressure on US living standards to finance this military expenditure. The fact that the US cannot afford both guns (high military expenditure) and butter (high living standards) means the US is spending above its income and therefore this inevitably causes its balance of payments and balance of trade deficits. To bring US spending down into line with its income, that is to eliminate the balance of payments deficit, either spending on guns or spending on butter will have to be reduced – i.e. eventually the US will be forced to chose between guns and butter.
Given this choice the logical path for the well being of the US people, of course, is to chose to maintain their living standards and to cut back on US military expenditure and the aggressive foreign policy which accompanies it. The latter not only puts downward pressure on US living standards but leads to deaths of US soldiers and spreads chaos in countries in which the US intervenes (e.g. Iraq, Libya). Unfortunately, however, the US political establishment wants the opposite – to maintain military expenditure. This therefore leads simultaneously to economic attacks on the US population and attempts to blame other countries for a balance of payments deficit which, as already shown, was created by US economic policy and not by other countries.
A major geopolitical danger in this situation is therefore that, to attempt to divert attention away from and conceal that the US balance of payments deficit is due to US economic policy itself, US administrations will attempt to blame other countries and carry out economic, or even military, attacks on them. In summary, the danger is that US economic failure will lead to it becoming more aggressive. For this reason China has to have strong military forces to able to defend itself against such unwarranted US attacks and also has to be prepared to deal with US unjustified economic attacks.
To return to the beginning of the article, as already stressed, the analysis here only deals with one fundamental aspect of the situation – that the US balance of trade deficit is ‘made in the US’ and not ‘made in China.’ China’s practical policy in this situation has to take into account numerous factors, but it is important to be entirely clear on the fundamental reasons for the US trade deficit.
1 Comments
Leave a Comment
You must be logged in to post a comment.
To put it simply John Ross,
USA companies, like WalMart, Apple, EVERYONE, see that they can
1/ lower their labour costs by taking their manufacturing to PRC,
2/ increase their profit margin by manufacturing offshore
3/ access the “magical” market of over 1 BILLION people of PRC, Remember the saying from that era: “If everyone in Chine buys $1 of our stuff, that’s over $1billon in sales…”
4/ only establish their plant in the PRC by sharing their know-how with joint ventures.
5/ sell they merchandise back in the USA at a lower price cf before.
They of course do this in the most ‘rational’ as defined in Economics 100, the workers of the USA can only send out “May Day, May Day” cries for help. But did anyone listen? No. let the invisible hand of economics do its job.
Did I sum it up correctly?
–