- Measured at current exchange rates the IMF projects that in the next five years’ growth in the B&R region measured in absolute dollar terms will be almost twice that in North America and four times that in Europe.
- Measured in purchasing power parities (PPP’s) growth in the B&R region will be almost five times that in North America and more than five times that in Europe.
Growth in the B&R region, in summary, will dwarf that in North America and Europe.
This fact that the B&R region has now emerged as the most powerful locomotive of the world economy is due to two simultaneous developments:
- Rapid growth in the B&R region,
- Extraordinarily slow growth in the West by historical standards.
The aim of this article is therefore to put more precise orders of magnitude on these trends. The data used is the five-year growth projections of the IMF. It should be made clear that using these figures does not at all mean that they are being taken as a 100% accurate prediction of what will occur. But the IMF data clearly establishes that the economic growth potential of the B&R region is so much greater than that of either North America or Europe that entirely implausible assumptions of future development patterns would have to be made for the far stronger growth of B&R not to be strikingly apparent.
This data therefore clearly establishes that the B&R region will be the main locomotive of the global economy during the next period.
Slow growth in the Western economies
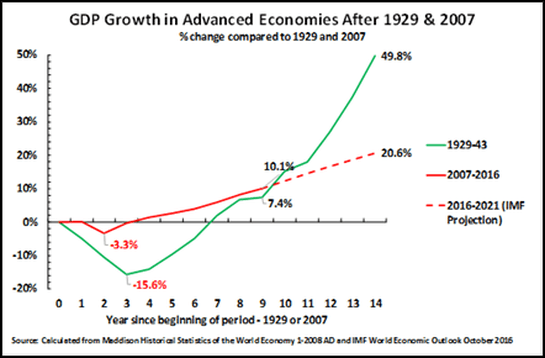
The first feature creating this new situation in the international economy is the quite extraordinarily low growth in the Western economies by historical standards. The statement sometimes made in the Chinese media that the period commencing with the international financial crisis of 2008 is the West’s ‘worst economic crisis since the Great Depression’ is somewhat misleading put in that form as in one crucial way it understates the problem. The overall slow growth and stagnation in the Western economies is already almost equivalent to that after 1929 while the factual projections for the next five years lead to the conclusion that the cumulative slow growth/stagnation of the Western economies will be worse, although different in form, from that during the following 1929. To show this Figure 1 illustrates three sets of data:
- Growth trends in the advanced Western economies after 1929.
- The factual trend in the advanced Western economies from 2007-2016;
- The latest IMF predictions for 2016-2021.
The data in Figure 1 of course shows that the onset of the ‘Great Depression’ after 1929 was far more violent than that of the international financial crisis in 2008. After 1929, during only three years, overall GDP of the advanced Western economies plunged by 15.6% compared to only 3.3% after 2007.
But it is not so widely understood that after the initial post-1929 economic collapse recovery during the 1930s was rapid and post-crisis growth was strong – the US being the most important exception. This can be clearly seen in Figure 1 and by examining the situation in 1938, the last year before World War II. By a convenient statistical coincidence, 1938 was nine years after 1929, and 2016, the most recent year for current factual data, was nine years after the last pre-international financial crisis year of 2007. Therefore, in comparing 1929-38 with 2007-16 the same length of time is being analysed.
The strong recovery of most advanced economies following the post-1929 recession is demonstrated by the fact that by 1938 the GDP of most major advanced economic centres was substantially above 1929 levels. To be precise by 1938:
- Japan’s GDP was 37% above its 1929 level;
- Germany’s GDP was 31% above its 1929 level;
- UK GDP was 18% above its 1929 level;
- Western Europe’s GDP was 13% above its 1929 level;
- The overall GDP of the advanced economies 7% above its 1929 level.
The US was an exception – US GDP in 1938 was still 5% below its 1929 level.
However, in contrast after the 2008 international financial crisis there was no rapid recovery and strong growth as there was after the post-1929 collapse. By 2016, nine years after the last financial crisis year, the recovery from the crisis in the advanced economies was almost as slow as during the ‘Great Depression’ of the 1930s and by the end of 2017 it will be significantly slower. More precisely due to the slow growth by 2016, total GDP growth in the advanced economies in the nine years after 2007 was only 10.1%. By the end of 2017, on IMF predictions, the growth in the advanced economies after 2007 will actually be lower than after 1929 – total growth of 12.3% in the 10 years after 2007 compared to 15.1% in the 10 years after 1929. Furthermore IMF data shows that the future growth in the advanced Western economies after the international financial crisis will be far slower than in the same period after the 1929. IMF projections are that by 2021, fourteen years after 2007, total growth in the advanced economies will be less than half that in the 14 years after 1929 – average annual growth of only 1.3% compared to 2.9%, and total growth of 20.6% compared to 49.8%.
Developing economies
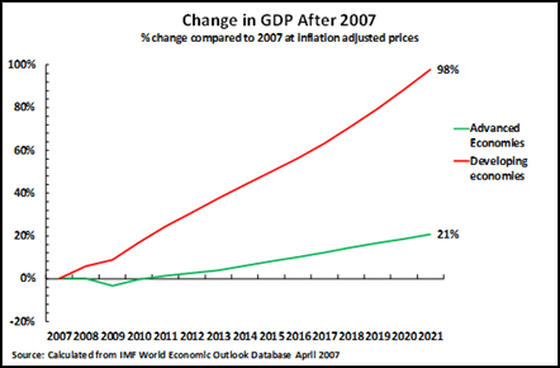
To grasp the present pattern of global development, and the background of B&R, it should however be noted that the data given above is specifically for advanced economies. Growth in developing economies is far faster both than in the advanced economies after 2007 and in the advanced economies after 1929. As shown in Figure 2 on IMF projections total GDP growth in the developing economies from 2007-2021 will be 98% compared to only 21% in the advanced economies. Annual average growth in developing economies in 2007-2021 will be 5.0% – not merely faster than the annual average growth of the advanced economies of 1.3% in the same period but much faster than the average 2.9% in the advanced Western economies in the 14 years after 1929.
The extreme slowing of economic growth in the present period is therefore specifically an issue of the advanced Western economies.
The B&R
Turning specifically to the B&R, which as will be seen is the most powerfully growing region among the developing economies, this is of course closely connected with China – which is now one the three great centres of the world economy with the US and the EU.
Comparing these three economic centres it is well known that measured at current exchange rates China’s economy is smaller than either the US or the EU – in 2016 China’s GDP was $11.2 trillion compared to $16.4 trillion for the EU and $18.6 trillion for the US. Measured in PPPs China’s economy is actually larger than the US but to avoid discussion of PPP calculations, and because data on savings is not available in PPPs, in this article all measures are at current exchange rates unless specified otherwise.
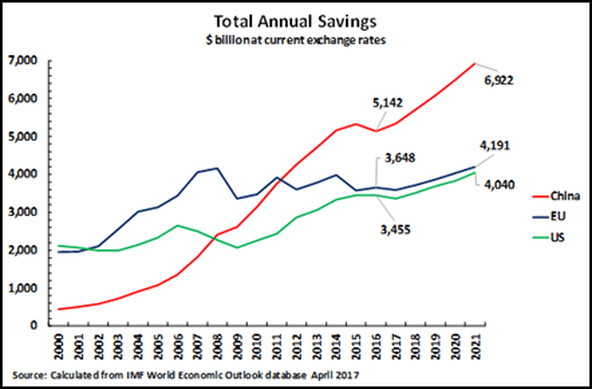
However, while China’s GDP is smaller than the US or EU it is not yet sufficiently widely understood that China already enjoys a decisive advantage over these other economic centres in one decisive field – savings, that is finance for investment. Furthermore, China’s considerable lead in this will get bigger with time. As shown in Figure 3 by 2016 China total annual savings – that is the sum of company saving, household saving and government dissaving – was $5.1 trillion compared to $3.5 trillion for the US and $3.6 trillion for the EU. By 2021 on IMF projections China’s annual finance created for investment will be $6.9 trillion, compared to $4.2 trillion for the EU and $4.0 trillion for the US.
In summary, while China’s GDP is smaller than the US China has already overtaken the US as a financial ‘superpower’. It is this which enables China to take initiatives such as AIIB and international fixed investment and infrastructure initiatives which are crucial in the B&R.
B&R as locomotive
Based on these economic fundamentals the comparative growth potentials of the B&R region, North America and Europe may now be analysed. As B&R is a regional initiative IMF data for North America, including Canada and Mexico, is given – rather than simply that for the US. For Europe the European Union (EU) as a whole is taken. Given this framework then:
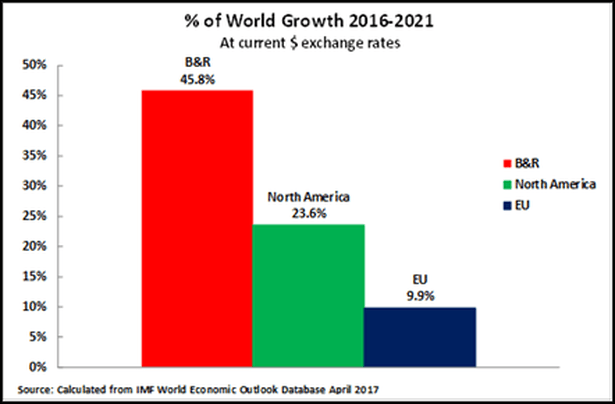
- Measured at current exchange rates projections from IMF data from 2016-2021 shows that in the next five years the B&R region will account for 46% of world economic growth – compared to 24% for North America and 10% for the European Union – as shown in Figure 4.
The situation in 2016
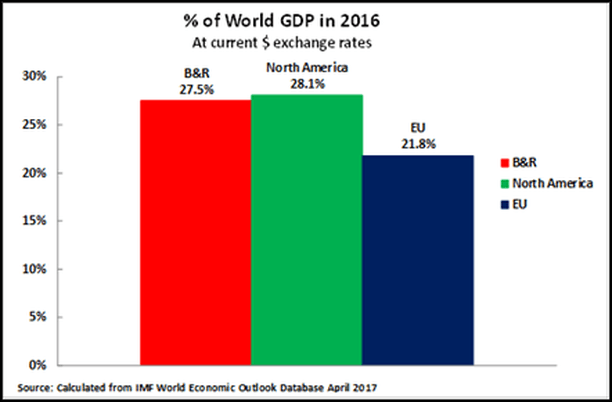
Turning now to the impact of the different growth potentials in the main world economic centres on the structure of the global economy, as a starting point Figure 5 shows that in 2016 the GDPs of the B&R region and the North American region were approximately equal in size while the EU was slightly smaller than either – B&R being equivalent to 27.5% of World GDP, North America 28.1%, and the EU 21.8%.
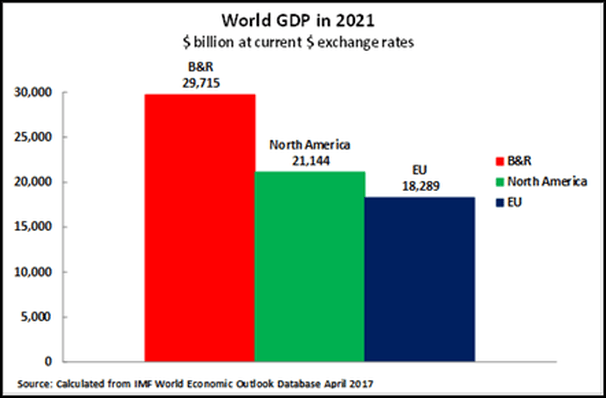
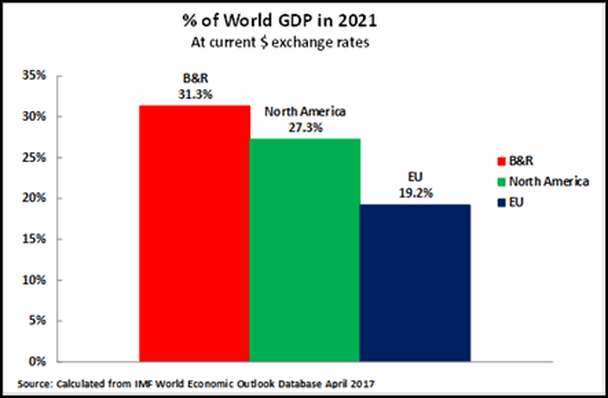
However, as the average growth rates in countries in the B&R region are much faster than those in either North America or the EU within five years the structure of the world economy will be sharply changed – as is shown clearly by Figure 6 and Figure 7. By 2021 the GDP of the B&R region, calculated from IMF data, will be $29.7 trillion, compared to $21.1 trillion for North America and $18.3 trillion for the EU. In percentage terms the B&R region will be 31.3% of world GDP – compared to 27.3% for North America and 19.2% for the EU.
Can another country block B&R?
The fundamental economic data also makes clear why no other individual country can block the success of B&R – specifically India cannot block B&R. This is due to the fact that while B&R is open to numerous countries economic realities make clear which countries are indispensable for B&R’s success.
Four large economies are within the B&R region – in descending order of GDP size China, India, Russia and Indonesia. Together these make up 79% of the GDP of the B&R region in 2016 and 85% of its projected growth in 2016-2021. However no other country makes up even 5% of the GDP of the B&R region or 2% of its projected growth – therefore no single other country than these four is by itself large enough to ensure the B&R initiative did not succeed.
Of these four large economies Russia and Indonesia are strong supporters of B&R and their presidents will attend the Beijing summit. India is therefore the only large economy in the B&R region which has indicated at the time of writing it will not participate in the Beijing summit.
This reticence is regrettable, and India’s enthusiastic participation in B&R would undoubtedly strengthen B&R. But in 2016 India was only 11% pf the B&R region’s GDP and 15% of its projected growth in 2016-2021. Put in other terms, 89% of the GDP of the B&R region and 85% of its growth potential was outside India. Given this weight India could not block B&R’s development even although its participation would be extremely valuable.
Tasks for the B&R
These macroeconomic trends naturally do not mean there are no problems for B&R. The advantage of North America and the EU is that their per capita GDPs are much higher than the B&R region, and both NAFTA and the EU have an institutional structure which B&R does not have nor is projected to have at present. But the much greater growth performance in the B&R region compared to any other, and therefore the vastly greater market expansion of the B&R region than any other, is much stronger than the institutional framework of the relatively stagnant North American and European economic centres.
It is clear that the B&R region is aided by, and can build on, the existence of a number of partial institutional frameworks within its area. These include the Association of South East Asian Nations (ASEAN), the Shanghai Cooperation Organisation (SCO), the existing Eurasian Economic Union (EAEU – Russia, Belarus, Kazakhstan, Armenia, Kyrgyzstan) and the Asian Infrastructure Investment Bank (AIIB). The wider proposed initiatives include the Regional Comprehensive Economic Partnership (RCEP) promoted by China. The wider concept of a Eurasian Union promoted by President Putin clearly overlaps with the B&R – as President Putin states.
The Beijing summit on 14-15 May will therefore have numerous tasks to work on not only its own projects but building and integrating existing initiatives. But the reshaping of the world economy by the B&Rs much greater growth potential than any other region is clear.
Conclusion
It may be seen from the data above that the differences in growth potential between the B&R and other major economic centres are not small – that is within the margin of error of five year economic forecasting . On IMF data projections:
- In the next five years, the B&R region will account for 46% of total world growth.
- The growth of the B&R region in the next five years will be almost twice that of North America, and over four times that of Europe.
- By 2021 the B&R region will account for a substantially higher share of world GDP than North America or Europe.
No plausible margin of error therefore alters the fundamental fact that in the next five years the B&R region will be by far the most important locomotive of the world economy. In particular, that the growth potential of the B&R region far exceeds that of North America and Europe. This reality must therefore be the basis of economic strategy in the coming period.
Related articles

Wrong analyses of China – listed by author and date

The real sinister relation of the US & ‘jihadism’?

China prepares for economic ‘prolonged war’ with Trump

Why the Latin American left, & the left in other countries, need to study China’s economic success