The first steps by Trump as US President confirmed that he will pursue an anti-China policy but also that he will use different tactics to Obama and Clinton. Simultaneously Trump has launched a serious conflict with Germany, supporting countries leaving the EU and demanding European states rapidly increase their military spending – policies rejected by Merkel at the recent Munich Security Conference. What, therefore, is the internal logic uniting such apparently different actions as:
- Trump bringing hard line China forces into the core of his administration;
- New Defence Secretary Mattis’s first foreign trip being to Japan and South Korea to emphasise support for THAAD and US military support for Japan;
- A new US policy by Trump of attempts to weaken or break up the EU, as opposed to supporting it;
- Trump’s criticisms of Germany;
- Trump’s deliberate confrontation with Mexico and fierce criticism of Australia,
- Trump’s announced economic strategy.
There is clarity regarding Trump’s actions towards China – the Tsai phone call, THAAD deployment in South Korea, Trump’s initial attempts in interviews to challenge the ‘One China’ policy and then his necessary acceptance of it in his phone call with Xi Jinping. But some actions by Trump’s are incorrectly seen as unrelated to China, as being counter-productive, or even as ‘bizarre’ – for example virulent criticism of Germany, one of the US’s most important allies, or a telephone shouting match with another close US ally, Australia’s prime minister. But the internal logic of these actions becomes clear when the real economic situation facing Trump is understood. Once the real US economic situation is analysed Trump’s foreign policy steps fall logically into place, and it will be seen that Trump’s actions towards Germany, Australia, Japan etc are indeed related.
To most adequately understand and respond to Trump’s policy, therefore, it is necessary to clearly understand its aims, its internal logic, and the ways it differs from Clinton/Obama. This article, therefore, focuses on the constraints on Trump’s economic policy and the way these determine his administration’s foreign and military strategy. First the real situation of the US economy will be demonstrated and then the possibilities for Trump to improve this analysed. From analysis of these realities the coherence and constraints which dictate Trump’s tactics in his foreign policy can be clearly understood.
he economic situation facing Trump
Self-evidently Trump’s goal is to strengthen the position of the US compared to all other states (‘America First’) and he recognises that improving the position of the US economy is the key to all aspects of this – including sustaining his promised US military build-up. But to understand the possibilities available for Trump to achieve this it is necessary to analyse accurately the situation of the US economy.
Various forces which either simply repeat propaganda without comparing it to facts present a myth that the US is undergoing ‘strong growth’ allegedly driven by ‘dynamic innovation’. This creates disorientation and inability to understand the logic of Trump’s actions. For the exact opposite is the case – it is the difficulties of the US economy which create the internal logic of Trump’s approach.
It was precisely because of the problems in the US economy that Trump was elected. US median wages are lower than in 1999 while simultaneously inequality has risen to the point where the total income of the top 20% of the US population is now greater than the combined income of the bottom 80%. It was deep popular economic discontent created by this situation which led to the candidates of the traditional Republican elite being swept aside in favour of Trump during the Republican primaries and to manual working class votes in previously Democrat voting states supporting him at the presidential election.
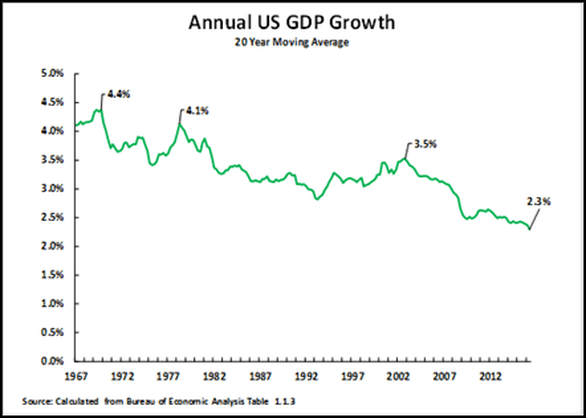
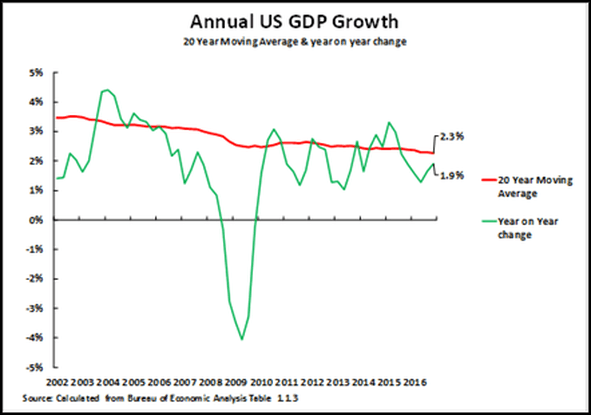
The real long term situation of the US economy is therefore demonstrated in Figure 1 which shows US annual average GDP growth, using a 20-year moving average to remove all purely short term fluctuations due to business cycles. This data shows clearly that the most profound trend in the US economy is a half century long economic slowing – the peaks of US growth progressively falling from 4.9% in 1969, to 4.1% in 1978, to 3.5% in 2003, to 2.3% by the latest data for the 4th quarter of 2016.
The immediate situation of the US economy
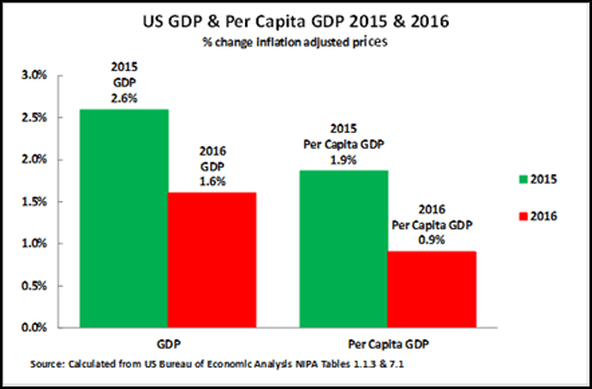
Turning to the more immediate situation for the US economy, this is shown in Figure 2 which confirms clearly the sharp slowdown in the US economy during 2016.
- US GDP growth fell from 2.6% in 2015 to only 1.6% in 2016 – that is during 2016 the US economy slowed down by almost 40% from its previous growth year’s rate.
- US per capita GDP growth fell from 1.9% in 2015 to only 0.9% in 2016 – US per capita GDP growth therefore declined to under half of its previous year’s growth rate, and fell to less than an annual 1%, which is approaching stagnation.
These trends show clearly that the claim of ‘strong recovery’ of the US economy during 2016 was entirely a myth. In fact, the US economy was slowing sharply compared even to the previous years
Comparison to other major economic centres
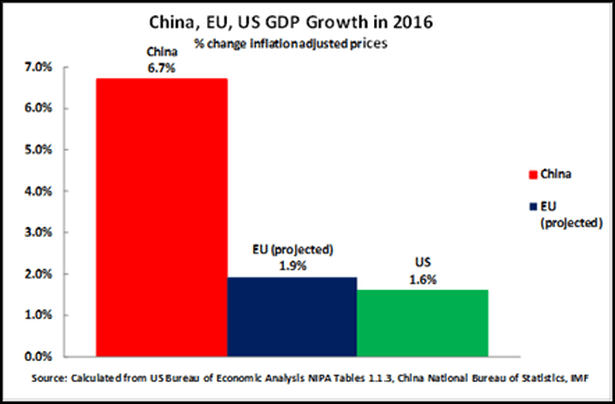
This data on the slowdown of the US economy is still more striking when compared to the statistics for the other two major world economic centres – China and the EU. What this data shows is that far from the US undergoing ‘strong recovery’, the US was the slowest growing of the major world economic centres in 2016
Final data for 2016 for China and the US is already published. Final data for the EU is not yet available, but it is published up the 3rd quarter of 2016, showing growth at 1.9%. The October 2016 IMF World Economic Outlook, based on the most up to date statistics, concludes this growth rate will continue until the end of the year. Given the closeness of this data to the end of the year it would be unlikely the final figure would differ greatly from this projection.[Note publication of the final EU data confirmed its 2016 growth rate at 1.9% – JR]
Given these trends GDP growth in 2016 would be:
- China – 6.7%
- EU – 1.9%
- US – 1.6%
Therefore, not merely did the US economic decelerate sharply in 2016 but the US was the slowest growing of the major economic centres.
The present US business cycle
Finally, the position of the US economy can be seen particularly clearly by comparing this US business cycle to previous ones.
As an economy is cyclical, for the most accurate analysis it is crucial that equivalent positions in the business cycle are compared. If only chronological measures are used then, for example:
- comparing a position at the peak of a business cycle to one at the bottom will give an exaggerated indication of economic growth,
- comparing the bottom of a business cycle to the top will understate average growth.
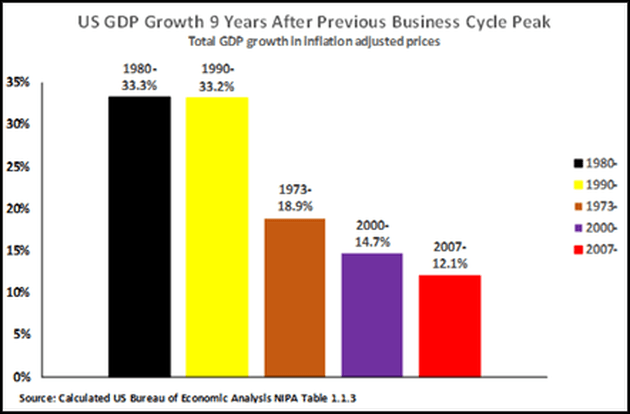
The peak of the last US business cycle was in the 4th quarter of 2007. The latest data for the US is for the 4th quarter of 2016 – exactly nine years since the peak of the previous US business cycle. Figure 4 therefore compares growth in the nine years between the 4th quarter of 2007 and the 4th quarter of 2016 with growth nine years after the peak of US previous business cycles in 1973, 1980, 1990, and 2000. This shows clearly that US growth in this business cycle is weaker than in any of these previous business cycles. Total US GDP growth after nine years during this business cycle is only 12.1%, compared to 14.7% after 2000, 18.9% after 1973, 33.2% after 1990, and 33.3% after 1980.
In summary, the factual situation is that far from Trump inheriting a US economy undergoing ‘strong growth’ due to ‘innovation’ Trump has inherited a US economy growing very weakly compared to its previous economic performance. It is therefore necessary to assess Trump’s possibilities to reverse such slow US growth.
Short term trends in the US economy
Confronted with this reality of very slow growth in the US economy Trump has claimed he will accelerate annual US GDP growth – he has announced a target of 4% annual growth. To accurately evaluate the chances of Trump’s success in this, given that the US economy is cyclical, it is necessary to separate short term from medium/long term trends.
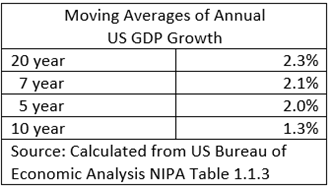
In calculating the medium/long term rate of growth of the US, trends are severely affected by any period which includes the Great Recession of 2008-09. Any short-term calculation including the Great Recession will necessarily show a very depressed US growth rate – long term trends will average out such effects. To analyse US growth trends Table 1 therefore shows 5, 7, 10 and 20 year moving averages for annual US GDP growth. The 10-year period, commencing in 2006, diverges strongly from the others as it shows a very low annual US growth rate – due, as noted, to the huge impact of the Great Recession. However, the 20-year moving average, which is a sufficiently long period to average out the impact of the Great Recession, and the 5 and 7-year growth rates all show US GDP growth rates relatively close together in the range of 2.0% – 2.3%. The medium/long term growth rate of the US economy, which should be used for evaluating the effects of Trump’s policies, may reasonably be calculated to be around 2% or slightly above.
Short term upturn
To evaluate purely short term trends as was noted above in 2016 as a whole US GDP only grew by 1.6%. This is significantly below the average long term growth rate of the US economy. Taking quarterly data, in the year from the 4th quarter of 2015 to the 4th quarter of 2016 US GDP growth was 1.9% – an acceleration from the very slow growth in the first half of 2016 but still below the US long term average. Therefore, US economic growth in 2016 was below its long-term average.
Figure 5 therefore shows a comparison to the 4th quarter of 2016 compared to the 20-year average – other comparisons can easily be calculated from Table 1. It may be seen that by any measure, except the 10-year average, which is severely depressed for reasons already noted, the US economy in 2016 was growing below its trend rate. The conclusion that flows from that is that there should be a short-term acceleration of growth during the early period of the Trump presidency, for the simple statistical reason that in 2016 the US economy was growing significantly below its long-term average and a move of the US economy up towards its long-term average growth rate will therefore create the illusion that the US economy is improving during the early period of Trump’s administration – when it is in reality a predictable statistical effect.
As this would coincide with the initial period of Trump’s presidency this would lead to the claim ‘Trump is improving the US economy’. But this is false, such acceleration would be expected purely for statistical reasons. The key question, however, is whether Trump can raise the long-term growth rate of the US economy?
he determinants of US growth
Turning from purely short term trends to assessing the potential for medium and long term US growth the reasons for the US long term slowdown already shown in Figure 1 are easy to analyse. The most fundamental of all features of the US economy is that it is a capitalist economy. This means when there is a high rate of capital accumulation the US economy grows rapidly, when there is a low rate of capital accumulation the US grows slowly – this basic theoretical analysis is fully confirmed by the data which follows.
Elsewhere, in ‘The Relation of Innovation and Fixed Investment in the US ICT Revolution’ [in Chinese] modern growth accounting methods were used to show factually that capital investment/accumulation is a decisive factor in US economic growth. For the most precise and accurate methods of analysing economic growth the data there can be consulted. However, the same fundamental result can easily be demonstrated using the simpler and familiar categories of US national accounts data so these are used in this analysis. In terms of economic statistics two measures could be taken as showing additions to capital in the US:
- The first is US net savings – new capital added by the US itself,
- The second is net investment – US savings plus investment in the US financed by saving from abroad.
Both will be analysed in turn. They show similar trends, as would be anticipated from the fact that the largest source of finance for US investment is US domestic savings, but they show some differences, due to US use of foreign savings for financing investment. It will be seen these differences have significant consequences for Trump’s foreign and economic policies.
Long term trends
A comprehensive study of the long-term development of the US economy was given in The Great Chess Game? [in Chinese] which should be consulted for further detail. A brief summary however clearly demonstrates the main underlying trends in the US economy.
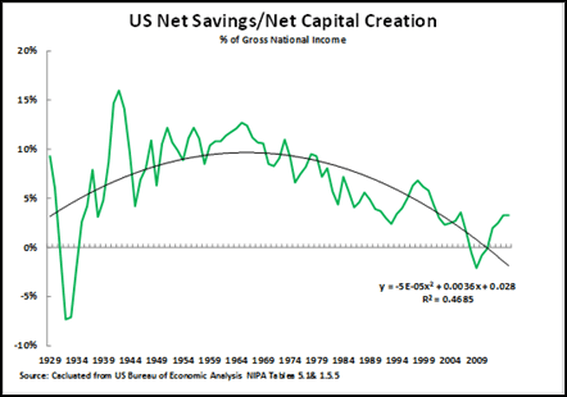
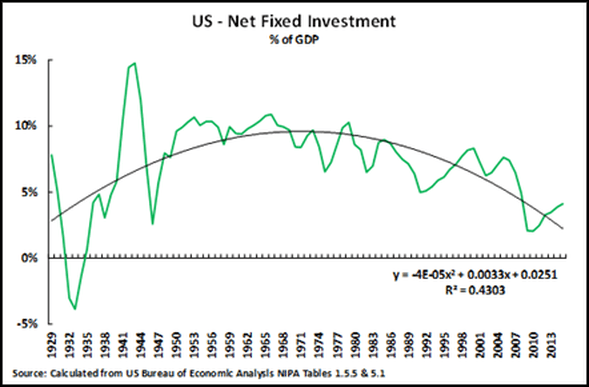
Analysing first capital accumulation by the US itself, in terms of economic statistics net capital accumulation by the US is equal to US net savings. Figure 6 therefore shows the long-term trend in the US savings rate/capital accumulation rate since 1929. The curve of long term development of the US economy is clear:
- During the crisis creating the beginning of the Great Depression in 1929-33 US capital accumulation was negative – that is the US economy was creating no capital. This necessarily produced a deep crisis of the US economy. After this the rate of US savings/capital creation rose, with a powerful acceleration during World War II, to reach a long-term peak as a percentage of the economy in 1965.
- After 1965 US net savings/capital creation steadily fell as a percentage of Gross National Income until it once again became negative during the ‘Great Recession’ in 2008-2009. This declining trend of US capital creation explains the long-term growth slowdown shown in Figure 1.
US use of foreign capital
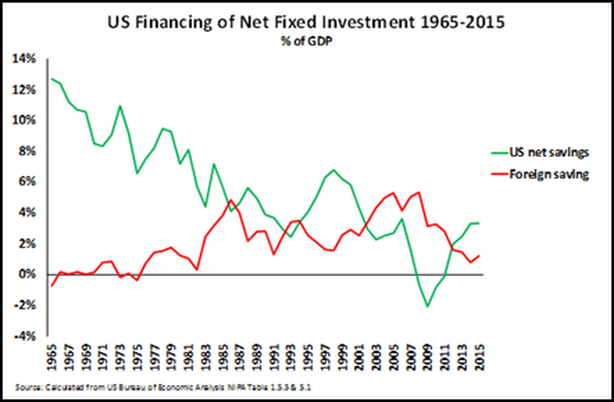
Turning to net fixed investment in the US, that is fixed investment financed not only be US but by foreign capital/savings, this is shown in Figure 7. This shows the same fundamental curve as for net savings by the US itself – rising from a low point in 1929-33, reaching a post-World War II peak (in this case in 1966), before declining again towards the Great Recession.
However, there is one significant difference between net savings by the US, and US net fixed investment – the latter including fixed investment financed by use of foreign savings/capital. Net fixed investment in the US did not actually become negative during the Great Recession as the US was able to use savings from abroad to finance US net investment. This use of foreign savings to finance investment meant that US net fixed investment remained higher than US net savings.
In short, during the Great Recession, the US was able to use foreign savings/capital creation to cushion and lessen the negative effect of the fall of the US’s own savings. This use of foreign savings/foreign capital creation helps determine the foreign policy choices for Trump – as will be analysed.
Shorter term trends on the US supply side
The above trends allow the basic economic constraints on Trump to be clearly analysed. The best fundamental approach to analysing the US economy, as with China’s, is via the structural features of its supply side – which brings out clearly the choices facing Trump and the interrelation of his economic policy with foreign and military strategy.
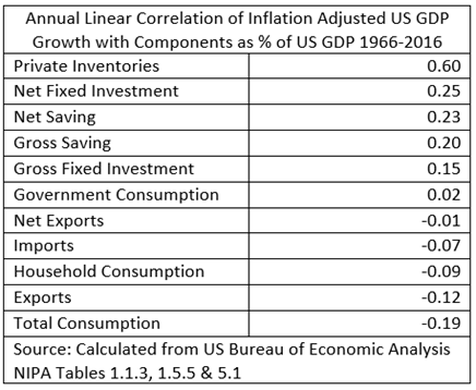
In the purely short term, as in all countries, numerous influences affect US economic growth– overall demand, trade, investment, consumption etc. This is clearly confirmed in Table 2 which shows the year by year correlation between US GDP real (i.e. inflation adjusted) growth and the size of components of the US economy measured as a percentage of GDP. This shows:
- The only such component of US GDP for which there is a strong correlation with real GDP growth in a single year (0.60) is the build-up or run down of inventories – which is logical as inventories are highly sensitive to economic accelerations and declarations.
- For other such components of US GDP there are correlations over a single year with real US GDP growth but none of these correlations are high – for example a positive correlation of the percentage of net fixed investment in GDP with GDP growth (0.25) and a negative correlation of the percentage of total consumption in GDP with GDP growth (-0.19).
Therefore, over the very short term, a single year, with the exception of inventory build-up/run down, there is no single major component of US GDP whose change of weight in the economy has a high correlation with US GDP growth.
These low correlations merely express in statistical form that in the purely short-term US economic growth cannot be predicted from changes as a percentage of US GDP of any single variable (except inventories).
Long term determinants of US economic growth
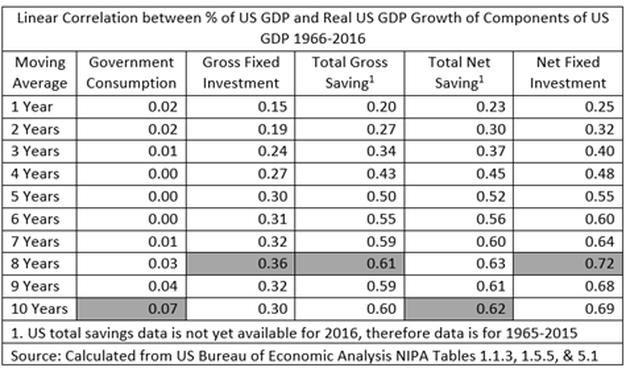
However, while short-term correlations between the structure of the US economy, the size of components of US GDP, and US GDP growth are weak a number of the medium/long term correlations are extremely high. This is illustrated in Table 3, which shows moving averages of from 1-10 years for the percentages of components of US GDP which have a positive correlation with real GDP growth. This shows clearly:
- There is essentially no correlation between the percentage of US government consumption in GDP and US GDP growth – the highest correlation is only 0.07. This data is important for reasons other than those forming the subject of this article, as it shows that for the US it is a myth that lowering government consumption as a percentage of US GDP leads to faster growth, and that raising government consumption as a percentage of GDP leads to slower economic growth – there is no evidence for this.
- There is a positive correlation between US gross fixed investment (fixed investment without deducting capital depreciation) and GDP growth but it is not high – a maximum 0.36.
- The very strong positive correlations with US GDP growth are with total gross savings (0.61), total net savings (0.62) and net fixed investment (0.72). For clarity, it should be noted total gross savings are not only household savings but also include company savings and government savings; net savings are total savings minus capital depreciation, and net fixed investment is gross fixed investment minus capital depreciation.
Such a difference between short and long term correlations regarding US economic growth is easily explained. It indicates that some structural components of US GDP are very powerful over the medium/long term but are simply overlaid in the short term by purely shorter term factors.
The decisive power of some of the key components of US GDP is therefore clear from both medium and long term trends. Already over a five-year period, which might be taken as the medium term, a correlation of the percentage of net saving and net fixed investment with US GDP growth is over 0.50. Over the longer term, the correlation of 0.72 over an eight-year period between US net fixed investment and US GDP growth is extremely high.
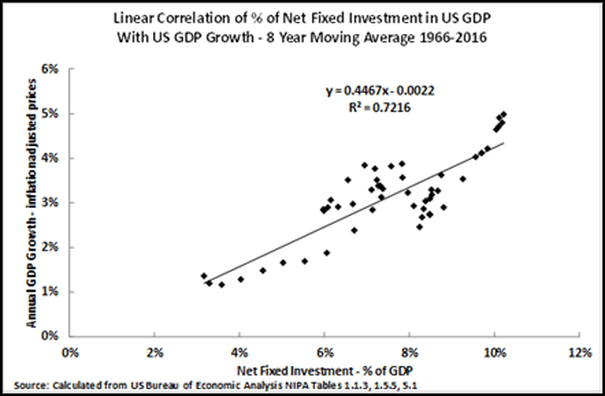
As the highest positive correlation is between net fixed investment, that is the annual net addition to the US capital stock and US GDP growth, it is this which will be analysed in detail.
The correlation of US net fixed investment and GDP growth
As is well known, correlation is not the same as causality. The high correlation between medium/long term movements in the percentage of net fixed investment in US GDP and US GDP growth does not by itself prove that a high percentage of net fixed investment in GDP causes higher GDP, that high GDP growth causes a high percentage of net fixed investment in GDP, or that some other factor(s) causes both. From the point of view of Marxist economic theory, as is used in China, it would be argued that the high percentage of net fixed investment in GDP causes higher economic growth, but for present purposes it is unnecessary to establish this. But this extremely high correlation (0.72) between US net fixed investment and GDP growth simply means that without achieving a higher level of net fixed investment Trump cannot achieve higher GDP growth. This extremely high correlation is shown in Figure 8.
Determinants of US growth
These facts regarding the long-term determinants of US economic growth necessarily decisively affect Trump’s ability to raise the long-term US growth rate. They demonstrate it is a myth that this can be achieved merely by innovation, tax cuts etc. The very close correlation between US net fixed capital formation and US GDP growth dictates that Trump can only realistically succeed in substantially speeding up the US economy’s medium/long term growth if US net fixed investment is raised. Put in the simplest terms, Trump can only accelerate US medium/long growth if the level of US capital accumulation can be raised – as is entirely logical given the capitalist nature of the US economy.
However, fixed investment necessarily requires exactly equivalent savings to finance it. Therefore, the question of whether Trump can raise the US long term growth rate in turn depends upon whether his administration can find sources of finance (savings) to raise US net investment.
To finance such an increase in US net fixed investment two potential sources exist – US domestic savings and foreign savings/capital. To raise net fixed investment in the US Trump’s policies must therefore either or both:
- Raise the US savings level,
- Increase US use of foreign savings
These two policies necessarily have very different political effects both within the US and internationally. In particular, as will be seen, they determine the basic features of Trump’s foreign policy.
Possibilities to raise US savings
Analysing first the US domestic economy, as this is divided into only consumption and savings, raising the percentage of the US economy devoted to savings necessarily means reducing the percentage of consumption in US GDP. Considered abstractly there are certainly ways Trump could achieve this without squeezing the percentage of US working class consumption in GDP – i.e. without squeezing the proportion of the US economy going to those who elected him. For example:
- Military expenditure from an economic viewpoint is consumption. Reducing military expenditure as a percentage of US GDP would therefore raise the US savings level without reducing the percentage of US GDP used for the living standards of the majority of the US population.
- Not all consumption is by the average population. Reducing consumption on luxury items would cut the consumption of the rich but would raise the US savings level without reducing the percentage of the US economy devoted to the consumption of the great majority of the US population.
But such economic methods go against Trump’s political priorities. Trump has stated his intention to increase military expenditure while a tax cut primarily for the rich is his key budget priority. Increased military expenditure, tax cuts on high incomes, and a possible government infrastructure spending programme will increase the US budget deficit – cutting government saving and, other things remaining equal, therefore reducing the US savings level. Given such commitments by Trump the only practical way he could achieve an increase in the US savings level would be to lower the proportion of the US economy allocated to consumption by the mass of the population. That is, given his other policies, the only way Trump could raise the US savings level would be to lower the proportion of the US economy used for the consumption of those who elected him – the consequences of which would be extremely unpopular.
As Trump only became President due to the non-democratic character of the US electoral system, with Clinton defeating him by almost three million in the popular vote, a significant part of the US political establishment is against him, and as his opinion poll satisfaction ratings have fallen faster than any previous US president, launching a strong economic attack on his own electoral base would be a risky policy for Trump.
Therefore, once Trump’s political goals are taken into consideration, it is highly improbable that the US savings level will rise – on the contrary it is likely to fall. This is certainly the market judgement regarding increased government borrowing – the yield on US 10 Year Treasury bonds rose from 1.83% on the day before Trump’s election to 2.35% on 9 February.
Use of foreign savings
If the level of savings by the US itself is not raised this only leaves the option of the US financing investment from foreign savings. Indeed, such a shift to greater reliance on borrowing foreign capital was a great historical change in the international position of the US inaugurated by Reagan. This relates to the difference of policies between Trump on the one hand and Clinton/Obama on the other. Clinton/Obama considered that it was necessary to make concessions to allies in order to form a broad ‘anti-China alliance’ – for example in the TPP and in Obama’s close political friendship with Merkel. Trump, as will be seen, in contrast considers that other countries must more directly subordinate their economic interests to the US, so that the US can strengthen itself for confrontation with China. US reliance on foreign borrowing for financing its investment, however, necessarily means that US economic policy becomes more tightly connected its foreign policy.
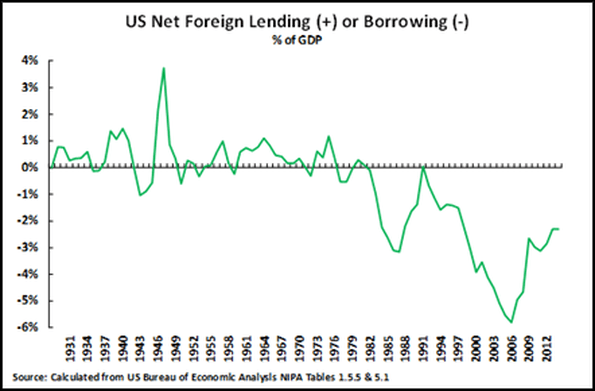
Analysing these trends historically prior to 1980, as Figure 9 shows, the US was normally a net lender of capital abroad – i.e. a net supplier of capital to other countries. This meant the US stabilised the international economy – both generally and more specifically in that the US could loan/grant capital to other countries if required to alleviate their economic/political situation. This was a key element of US foreign policy during the 1950-70s. US foreign policy in that period was able to use the powerful combination of not only the ‘stick’ of military threats but also the ‘carrot’ of large scale economic aid.
But after 1980, as Figure 9 shows, the US became a net international borrower of capital – using other countries capital to finance its own investment. Such borrowing reached a peak of almost 6% of US GDP in 2006 on the eve of the international financial crisis. This meant that the US itself was using other countries capital instead of them using it for their own development. In foreign policy terms, the US overall no longer had the ‘carrot’ of large scale aid to the rest of the world but only the ‘stick’ of military force. US economic policy became a net destabilising factor internationally – this overall position naturally not excluding US support to certain privileged states (e.g. Israel, Egypt, Ukraine).
Reagan, who launched this turn to financing US investment by foreign capital, did not stop the slowing of the US economy – as was clear from Figure 1. But Reagan was effective in ensuring other countries financed US. In particular Japan provided the main international source of funds for the US throughout the Reagan period – as analysed below. The consequences of this huge extraction of funds from Japan by the US was one of the chief reasons for the two-decade long economic stagnation of Japan after the 1980s.
Financing of US investment from abroad
Turning to a more detailed examination of this US turn to financing its investment by foreign capital this is shown in Figure 10, which gives – data for the financing of US net capital creation, i.e. US investment not financed by US depreciation allowances on existing capital. This shows that from Reagan onwards the US became increasingly dependent on the use of foreign capital/savings for financing net investment. Indeed from 2002 to 2012, astonishingly, more US net capital formation was financed from abroad than was financed by the US own savings! After 2012 US net savings regained a positive level but:
- The level of net US savings by 2015, the latest available full year data, remained low by historical standards – 3.3% of Gross National Income. The data for the first three quarters of 2016, the most recently available, shows this declining to an average of 2.8%.
- A significant part of the improvement of US net saving was due to the reduction of military expenditure under Obama – US military expenditure fell from 4.7% of GDP in 2007 to 3.9% of GDP in 2016.
In summary, US net saving remains low while simultaneously Trump’s proposed economic policies are likely to reduce US savings. Given Trump’s policies, therefore, there is little scope to raise US net savings levels. Therefore, any moves by Trump to accelerate US GDP growth, which depends on raising fixed investment, require greater use of foreign savings. This in turn underlies Trump’s foreign policy choices.
Which countries can finance US investment
The real situation of the US economy therefore immediately poses the question of which countries could potentially finance Trump’s projected accelerated US growth? The number of countries able to do this is extremely small given the huge size of US foreign borrowing.
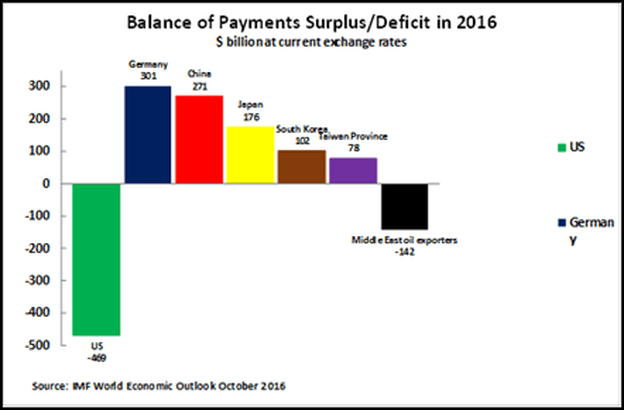
The IMF estimates, in October 2016’s World Economic Outlook, that the US balance of payments deficit in 2016 would be $469 billion – the current account balance of payments of any country is statistically equal to the foreign inflow of capital with the sign reversed. To show which countries could potentially finance such a scale of borrowing as by the US Figure 11 therefore shows the US balance of payment deficit together with the five countries/regions with the largest dollar balance of payments surpluses – these are, in descending order, Germany, China, Japan, South Korea, and Taiwan Province of China. The combined Middle East oil exporters are also shown as in the past these played a major role in financing the US.
Due to the size of the US foreign borrowing other countries have surpluses which are too small to play a decisive role in financing this and therefore analysis will concentrate on these major surplus countries. Once these are analysed the internal logic of Trump’s foreign policy positions falls clearly into place.
The international economic situation facing Trump
In carrying out a policy dependent on foreign borrowing Trump faces a situation much more complex than US presidents from Reagan to Obama due to the cumulative changes in the international economy brought about by the 2008 international financial crisis.
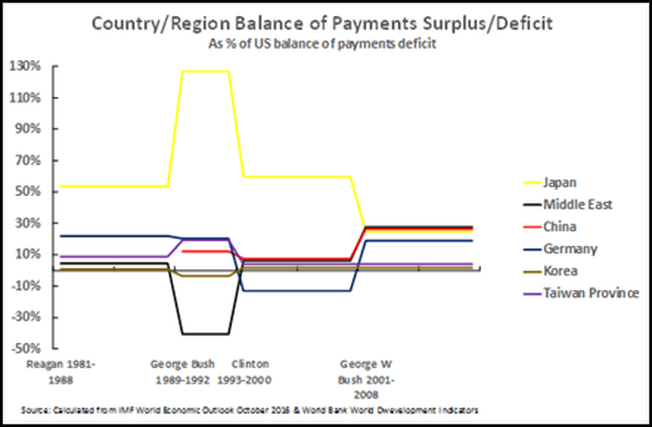
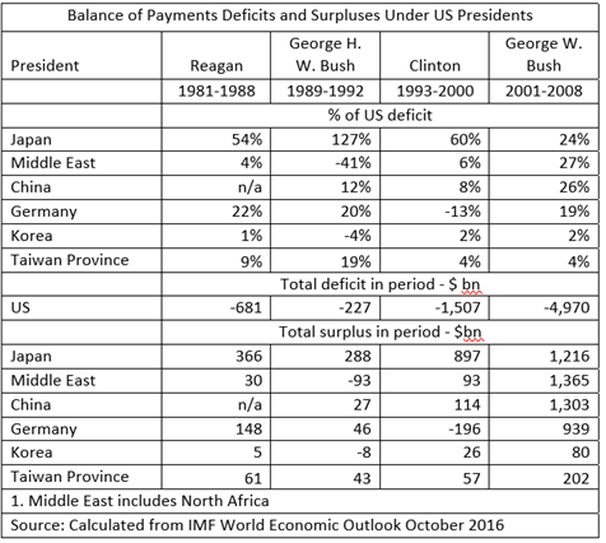
First, to demonstrate the simple situation for foreign borrowing faced by US presidents from Reagan to George W Bush, Figure 12 and Table 4 show the surpluses available from countries for financing of the US balance of payments deficit – and therefore for US foreign borrowing. For each country/region its cumulative balance of payments surplus/deficit during a presidency is shown in absolute terms in Table 4 and as percentage of the US balance of payments deficit in Table 4 and Figure 12. Thus, for example, during Reagan’s presidency the total US balance of payments deficit with all countries was $681 billion while Japan’s balance of payments with all countries was $366 billion – under Reagan Japan’s balance of payment surplus was equivalent to 54% of the US balance of payments deficit.
This data shows clearly that from Reagan to Clinton Japan was the decisive country for financing US international borrowing. Japan’s balance of payment’s surplus was equivalent to 54% of the US balance of payments deficit under Reagan, 127% under George H.W. Bush, and 60% under Clinton. Prior to George W Bush, therefore, Japan could be the essential international source of US finance – provided Japan followed economic policies satisfactory to the US merely adding resources from a few smaller other countries to Japan’s finance could satisfy US borrowing needs.
Weakening of Japan’s economy
But while this situation of financing the US deficit from Reagan to Clinton was satisfactory for the US it was disastrous for Japan. In particular, after the 1987 Wall Street stock market crash the US demanded Japan follow ultra-low interest policies to allow finance to flow out of Japan into the US, thereby allowing the US to avoid the negative consequences of the stock market crash. The result within Japan of such ultra-low interest rates was the late 1980s Japan ‘bubble economy’ and the ensuing disastrous Japan financial crash beginning in 1990s. Japan’s economy has still not recovered over a quarter of a century later from this financial catastrophe, passing into more than two decades of near economic stagnation.
The huge transfer of resources from Japan to the US under Reagan/George Bush/Clinton therefore financed the US economy but devastated Japan’s. However, as Japan is a semi-colony of the US, Japan was simply forced to follow policies which damaged its own economy but aided the US.
However, the cumulative effect of the huge economic blows dealt to Japan was that by the beginning of the 21st century Japan alone became too weak to finance a large part of the US deficit. During George W Bush’s presidency, 2001-2008, the percentage of the US balance of payments deficit that could be financed by Japan’s surplus fell to only 24% – too little to finance US needs. However fortunately for the US, prior to the international financial crisis, weakening of Japan’s ability to meet US financing needs did not lead to severe problems for the US as George W Bush found two additional international sources of finance. These were:
- Middle East oil exporters, whose balance of payment surplus was equivalent to 27% of the US balance of payments deficit due to the high oil price,
- China – whose balance of payment surplus was equivalent to 24% of the US balance of payments deficit.
The ability of the US to tap these two new sources of finance, however, necessarily entailed foreign policy choices. The easy one of these for the US was with the Middle Eastern oil exporters. Many of these (Saudi Arabia, Kuwait, UAE etc) are essentially in the same position as Japan in being entirely subservient to the US and can therefore, if necessary, be instructed/pressured to finance US deficits.
China, however, is not in that situation – it is not a semi-colony of the US or subservient to it. But George W Bush, throughout most of his presidency, maintained reasonable foreign policy relations with China – not seeking to create great tensions. This created a mutually beneficial situation in which China was content to de facto aid financing the US balance of payment deficit in return for no major trade or political tensions existing with the US.
George W Bush’s presidency, by balancing three major sources of foreign financing for the US – Japan, the Middle East oil exporters, and China – therefore did not prior face great problems in meeting US foreign borrowing needs prior to the international financial crisis.
Trends after the international financial crisis
The consequences of the 2008 international financial crisis, however, cumulatively radically changed the previous relatively easy situation regarding potential sources of US international borrowing. This is shown in Figure 13 – in this figure the percentages at the end of the graph lines are for the country/region’s balance of payments surplus/deficit as a percentage of the US’s 2016 balance of payments deficit. The data is calculated from the IMF’s October 2016 World Economic Outlook.
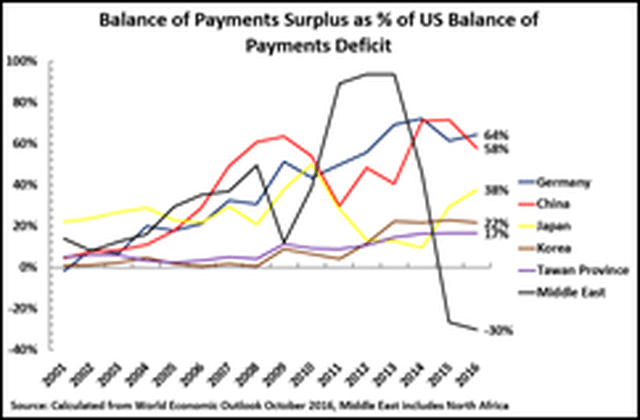
As may be seen, Japan’s balance of payments surplus remains too small to play the same decisive role in financing US deficits as under Reagan/George Bush/Clinton – Japan’s surplus is only 38% of the US deficit. But the crucial new factor confronting Trump is the collapse in the surplus of the Middle East oil exporters due to the fall in the oil price.
As recently as 2013 the Middle East oil exporters balance of payments surplus was equivalent to 94% of the US balance of payments deficit. Therefore, Middle East Oil exporters by themselves could virtually finance US foreign borrowing needs. Two sources of finance wholly subordinate to the US, Japan and the Middle East, could potentially meet all US foreign borrowing needs.
But the oil price fall, produced by the cumulative slowdown in the global economy after the international financial crisis, devastated the international position of Middle East oil exporters. By 2016 the Middle East Oil exporters had moved from surplus into a large collective balance of payment deficit of $142 billion. Only a major increase in the oil price, due either to a strong upturn of the world economy or increased fossil fuel use, could restore the Middle East oil exporters balance of payments surpluses and therefore their ability to finance the US. Certainly, an increase in the oil price would aid the US fracking industry, and it is a deliberate policy of Trump to seek to increase the use of fossil fuels whatever the consequences for global climate change, but no such large increase in the oil price has yet occurred. Therefore, Middle East oil exporters are currently in no position to finance the US balance of payment deficit.
Germany and China
The result of all these international changes is that only two countries, Germany and China, now have very large balance of payments surpluses. On the latest IMF data in 2016:
- Germany had a balance of payments surplus of $301 billion, equivalent to 64% of the US $469 billion deficit.
- China had a balance of payments surplus of $271bn, equivalent to 58% of the US deficit
But neither China nor Germany is anything like as easy for the US to force to finance its requirements as are Japan or the Middle East oil exporters.
- Germany is military dependent on the US, and seeks good relations with it, as vividly shown in close Obama-Merkel ties. But Germany is the centre of the EU whose total economy is larger than the US. Germany, therefore, has considerably greater leverage for negotiation with the US than does Japan or Middle East oil exporters.
- China is not at all dependent on the US in the same way as Japan/Middle Eastern oil exporters. China certainly prefers friendly/stable relations with the US, and would be prepared to make sensible economic compromises in that framework. But China is not in any sense a US semi-colony. China can be negotiated with, but China cannot be ordered around, and has clear red lines on issues such as territorial integrity, the South China Sea etc.
In summary, both countries with very large scale balance of payments surpluses, Germany and China, to different degrees, are much harder for the US to extract resources from than Japan or the Middle Eastern oil exporters.
Outside of these, two areas exist where modest US gains for international financing can be made. South Korea and Taiwan Province of China are both now accumulating medium sized balance of payments surpluses – in 2016 South Korea’s was $102 billion and Taiwan Province of China’s was $78 billion. Neither South Korea nor the leadership of Taiwan Province can afford to disobey pressure from the US and therefore they can be forced to pay more to the US. Indeed, Trump’s rhetoric during his election campaign, denouncing US ‘allies’ for failing to pay sufficient for US military protection, was clearly aimed at extracting larger resources from Japan, South Korea and the leadership of Taiwan Province of China.
But useful as extra resources from South Korea and Taiwan Province would be for the US, even added to the resources from Japan these are insufficient for US financing requirements, The only countries with really big financial resources are Germany and China, and it is therefore relations with Germany and China which forms the economic core of the foreign policy choices facing Trump.
Germany
Analysing first Germany, Germany’s extremely large balance of payment surplus arise from its historically powerful economy, which continued during the post-World War II period, but this was reinforced after 1990 by two extremely powerful interrelated factors:
- In 1990 Germany reunified, significantly increasing the size of its economy,
- In 1992, largely in response to Germany reunification, the Treaty of Maastricht established the Euro.
In turn, the Euro produced two powerful competitive advantages for Germany:
- The Euro prevented countries within the Eurozone (France, Italy, Spain etc) from carrying out competitive devaluations against Germany.
- As other Eurozone countries were less internationally competitive than Germany, the Euro’s exchange rate was lower than would have been the old German Deutsche Mark – thereby aiding Germany’s competitiveness outside the Eurozone.
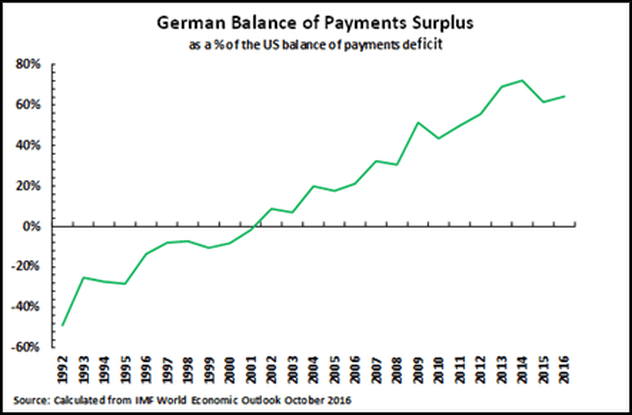
The result was that while German reunification created certain short term economic difficulties overall it greatly strengthened Germany’s economic position including in comparison to the US. This is demonstrated clearly in Figure 14 which shows Germany’s balance of payments surplus as a percentage of the US balance of payments deficit. As already noted by 2016 Germany’s balance of payments surplus reached $301 billion, or equivalent to 64% of the US deficit.
This relation with Germany is therefore the first key international economic/foreign policy issue for Trump. To serve the interests of Trump’s economic policies Germany must either, or both:
- be persuaded voluntarily to pursue an economic policy which more aids the US, or,
- be weakened so as to allow the US to become stronger relative to Germany so that the US can extract greater resources from Germany or other countries in the EU.
Most effective for the US in pursuing such a course would undoubtedly be a ‘carrot and stick’ approach to try to get Germany to change economic course is a way more favourable to the US. But, as already analysed, the US now has such large needs for financing from abroad that it has few significant economic carrots to offer Germany. Therefore, only the ‘stick’ is available – to attempt to intimidate Germany to change economic course and adopt policies which would make it weaker and the US stronger. This stick is precisely the threat to weaken Germany by encouraging other countries to leave the EU and/or Eurozone. This is why Trump has reversed the US’s historic policy of support for the EU and instead is attempt to weaken or disintegrate it. This explains the strong public attacks made on Germany by Trump and leading members of his administration.
A few other US allies fall in the same category as Germany, i.e. countries for which carrots are not available so the stick must be used. Australia, for example, does not have remotely the same financial resources as Germany but even a few billions squeezed out of it over a period of time could be useful for the US – therefore the Australian prime minister is insulted to make sure that he understands his subordinate place and he must be prepared to give greater resources to the US. Trump’s telephone rants against the Australian prime minister were not ‘irrational’ or ‘bizarre’ – they were part of a policy of attempting to intimidate ‘allies’ to transfer greater resources to the US.
However, among US allies it is above all Germany which has large economic resources but which is not fully under US economic control, unlike Japan or the Middle Eastern states. Therefore, Trump must seek to intimidate Germany. Equally for Germany maintenance of the Eurozone & EU against Trump’s attacks has become a decisive foreign policy and economic issue.
The political danger for the US in this clash is that opposition to Trump among Europe’s population will sharply increase – as well as in smaller countries such as Australia. Indeed, such a process is clearly already occurring.
China
In policy to China, Trump bringing into the core of his administration some of the hardest line anti-China US forces, symbolised by National Trade Council director Peter Navarro, author of Death by China, leaves no doubt as to the Trump administration’s hostility to China. This also easily explains such actions as the phone call with Tsai, the rapid commitment to deployment of THAAD, Trump’s initial post-election threats to overturn the One China policy etc.
But Trump simultaneously faces a dilemma. Australia’s prime minister can be insulted, South Korea can be ordered around militarily, Japan is a semi-colony of the US etc. But Germany and China are two of the world’s strongest economies. While Germany relies on the US militarily, giving Trump leverage, Germany’s position within the very large EU/Eurozone area means Germany cannot be seriously economically intimidated by the US while China cannot be ordered around by the US.
It would, therefore, be a considerable risk for the US to launch simultaneously an economic/political struggle against both Germany and China – two of the world’s most powerful countries. As Trump regards China as a more powerful rival to the US than Germany, a less risky strategy would be to delay a full-scale confrontation with China until after (hopefully) Germany had been forced into line with US demands. Such a success by Trump would certainly mean an economic weakening of Germany, and would therefore be expected to meet resistance in that country, but in the 1990s Japan literally wrecked its own economy to meet US demands. Perhaps Germany can also therefore be intimidated into carrying out policies which are against its own interests but in the interests of the US?
Therefore, whether Trump should proceed immediately to confront China, or whether his administration should adopt a more delaying tactic to China until it has (hopefully) intimidated Germany into submission is therefore a key tactical issue for Trump and undoubtedly explains some of the contradictory signals coming from his administration. The decision to finally declare support for the One China policy in Trump’s phone call with Xi Jinping, therefore, certainly reflects China’s own strength, and its refusal to compromise on this issue, but also involves calculations by the Trump administration that a simultaneous confrontation with Germany and China may be too risky.
This international situation therefore undoubtedly has consequences for China. China has strong ties with South East Asia. China has built very good relations with Africa. China is strengthening relations with Latin America. The One Belt, One Road (OBOR) initiative can further strengthen China’s relations with Central Asia, Russia, and countries such as Iran. But Trump’s new attack on Germany means that Europe, particularly Germany, has now become a key area of direct concern for China.
Germany will attempt to defend its own economic interests for its own sake not China’s, but nevertheless Germany’s defence of its own interests, and of the EU/Eurozone against Trump’s attacks, is directly in China’s interests.
Conclusion
To summarise, this article shows that actions by Trump, both those directly related to China and those which are sometimes portrayed as ‘bizarre’, such as offensive behaviour to US allies, are connected once the real economic choices confronting Trump are understood. The chief parameters are:
- It is a myth that the US economy is undergoing rapid innovation driven growth. The US economy has been slowing for over half a century and in 2016 its economic growth was even lower than other major economic centres. While US growth in 2016 was so slow it is likely that in 2017 there will be some acceleration purely for statistical reasons, this by itself is purely short term and would not represent any long term strengthening of US growth. Indeed, the reality is it was popular discontent created by slow US growth which explains why Trump was elected.
- While various measures could be taken which would increase US growth in purely the short term (increase in overall demand, increase in consumption etc) to accelerate US growth over the medium/long term Trump would have to increase the level of US net investment. Without such an increase in the level of capital accumulation claims by Trump he will accelerate the US rate of growth are merely ‘hot air’.
- Trump’s policies, such as increased military expenditure, tax cuts for the rich, combined with the political risks to his support that would be involved if he attempted to cut the share of working class consumption in US GDP, means that it is unlikely the US savings rate will rise. Therefore, an increase in the investment level in the US could not be financed from US resources and would have to be financed from abroad.
- Unlike US Presidents from Reagan to Obama, who could fundamentally finance the needs of US investment from countries entirely subservient to the US (Japan, Middle East oil exporters) Trump can only extract moderate resources from countries similarly subservient to the US (Japan, South Korea, Taiwan Province of China) while the Middle East oil exporters are no long able to provide major resources to fund the US. Smaller US allies, such as Australia, can be intimidated to provide extra resources for the US but their economies are too small to supply resources to the US on the scale it requires. The only two economies with sufficiently large resources to meet US international financing needs are Germany and China.
- As the US has no economic ‘carrots’ to offer Germany therefore the US must use ‘sticks’ in order to attempt to intimidate Germany to pursue policies more favourable to the US even at the expense of Germany weakening its own economy. This ‘stick’ is the attempt to break up the Eurozone/EU.
- The presence of hardened anti-China forces in the core of the Trump administration makes clear its anti-China orientation. However, it would be a risky policy for Trump to attempt simultaneously to have a severe confrontation with both Germany and China. Therefore, the Trump administration has to balance those who favour an immediate confrontation with China with those who believe the US must first to force Germany into line before confronting China. The result is some hesitations and confusions in Trump policy. But for the present the latter group appears dominant – as signalled in Trump’s announcement of support for One China. However, this does not mean that the anti-China wishes of the Trump administration have been ended, merely that it believes it must first secure other goals before moving to full scale confrontation with China – notably Germany must be forced into giving greater support to the US even if this weakens Germany’s own economic position.
- This international situation means for China that in addition to its existing good relations with South East Asia, Africa, Latin America, and Russia and Central Asia and the Middle East in OBOR, China’s relations with Europe, in particular Germany, will acquire a greater significance. While Germany will undertake defence of its economy, and therefore of the EU/Eurozone, for its own interests nevertheless these interests objectively coincide with those of China.
As always therefore policy must be based on reality not misunderstandings. Trump is not ‘bizarre’ or ‘irrational’ – no one who is would achieve such a powerful position as US President. His actions only appear ‘irrational’ if the real economic situation facing the US, and the way this determines US foreign policy, is not understood. Once the real situation of the US is analysed the integration of Trump’s foreign policy with his economic goals is entirely clear.
It follows that an accurate understanding of Trump, and the policy to take to him, must break with myths regarding the US and instead ‘seek truth from facts.’
* * *This article was originally published in Chinese on 22 February 2017 at Guancha.cn.
Related articles

Why China won’t suffer a Western type financial crisis

US calls for China to adopt policy to kill millions of Chinese by Covid in name of “human rights”

China’s economy is growing three times as fast as the US

COP26: why advanced countries must proportionately make by far the biggest cuts in carbon emissions – factual briefing