The latest US economic data confirms the US remains locked in a prolonged period of slow growth with major consequences for geopolitics and destabilising consequences for US domestic politics.
The latest US economic growth data
Almost no international issue is more crucial for economic and geopolitical strategy than economic trends within the US. It is therefore crucial to have an accurate analysis of these. Regarding such a serious issue and such powerful forces there is no merit in ‘pessimism’, underestimating US growth, and no merit in ‘optimism’, overestimating US growth – there is only a virtue in realism.
This article therefore analyses the latest US GDP data. The conclusion is clear. The data confirms the US fundamentally remains in a period of medium/long term slow growth which will last for at least a minimum of several years.
Strikingly, taking a period of 15 years after the beginning of the international financial crisis, average US growth will be slower than after the beginning of the Great Depression in 1929. Analyses which appear in parts of the media claiming the US is entering a significant new period of rapid growth are fundamentally in error – for reasons analysed in detail blow.
Such slow US growth necessarily has major geopolitical consequences and provides a backdrop for continuing instability and turns in US politics. The recent period within US politics has already seen:
- Trump selected as Republican Party Presidential candidate against the wishes of that Party’s establishment, and elected President against the opposition of the overwhelming major of the US mass media.
- Since Trump’s election sharp clashes have continued within the US political establishment with leaks against the President by the US security services, the President’s sacking of the FBI head, investigations by the US Congress and US police of close aides to the President, and open campaigns to force the President to change policies or to remove him from office by major US media such as the New York Times and CNN.
- Within the Democratic Party a serious challenge mounted to the Party establishment’s candidate Clinton by the first figure declaring themselves to be a socialist to receive major US public support for almost a century – Sanders.
As US medium/long term slow economic growth will continue sharp turns and tensions in US politics will not disappear but are likely to continue.
The consequences for US relations with China flowing from this situation, and geopolitical tensions between the US and its traditional allies such as Germany shown for example at the recent G7 summit, are analysed at the end of this article. The conclusion is that China’s constructive approach to the Trump administration is clearly correct but that the risk of sharp turns in the situation must be taken into account due to the tensions within the US created by its historically low growth.
This prolonged period of slow growth in the US, and in the advanced economies in general, combines with China’s own transition to ‘moderate prosperity’, and then to a ‘high income’ economy by World Bank international standards, to create under Xi Jinping a qualitatively new period in China’s development.
The Great Stagnation
Starting with the global background to the latest US economic data, a defining feature of the present overall international situation is extremely slow growth in the advanced Western economies.
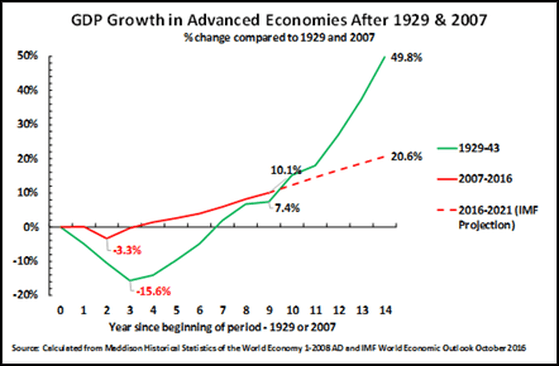
In nine years since the 2008 international financial crisis average growth in the advanced Western economies is already almost as slow as during the ‘Great Depression’ of the 1930s and by the end of 2017 it will be significantly slower. By 2016, total GDP growth in the advanced economies in the years since 2007 was only 10.1% and by the end of 2017, on IMF projections, the growth in the advanced economies after 2007 will be lower than in the same period after 1929 – total growth of 12.3% in the 10 years after 2007 compared to 15.1% in the 10 years after 1929.
Even more strikingly IMF data projects that future growth in the advanced Western economies, following the international financial crisis, will be far slower than in the same period after 1929. IMF projections are that by 2021, fourteen years after 2007, total growth in the advanced economies will be less than half that in the 14 years after 1929 – average annual growth of only 1.3% compared to 2.9%, and total growth of 20.6% compared to 49.8%.
This data is shown in Figure 1. An aim of this article is instead to carry out the necessary factual checks that the latest US data does not represent a break with long-term trends.
US GDP growth
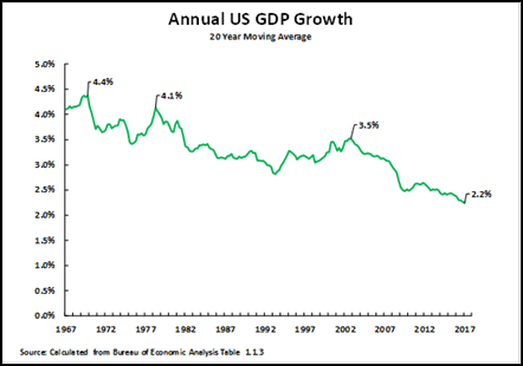
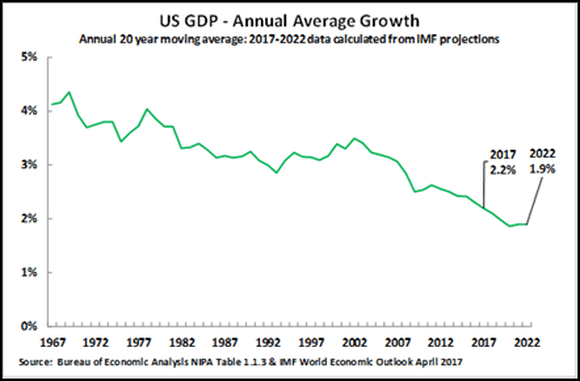
In the 1st quarter of 2017 US GDP was 2.0% higher than in the first quarter of 2016.[1] To evaluate this 2.0% growth, given that a market economy inherently displays business cycles, it is necessary to separate purely cyclical trends from medium/long term ones. Failure to do so leads to false analysis/statistical trickery – comparing a peak of the business cycle with the trough will exaggerate growth, while comparing the trough of the business cycle with the peak will understate growth. Such cyclical effects may be removed by using a sufficiently long term moving average that cyclical fluctuations become averaged out and the long term structural growth rate is shown. Figure 2 therefore shows annual average US GDP growth using a 20-year moving average – a comparison to shorter term periods is given below.
Figure 2 clearly shows that the fundamental trend of the US economy is long-term slowdown. Annual average US growth fell from 4.4% in 1969, to 4.1% in 1978, to 3.2% in 2002, to 2.2% by 1st quarter 2017. That is, the most fundamental long term growth trend in the US economy is that it has been slowing for half a century. The latest US GDP growth of 2.0% clearly does not represent a break with this long term US economic slowdown but is in line with it.
Per capita
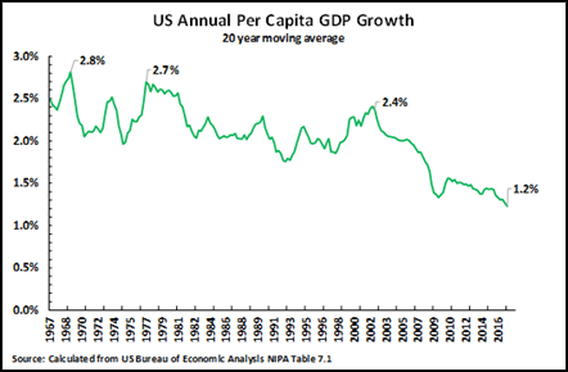
US per capita GDP growth follows the same falling trend. Figure 3 shows a 20-year moving average for US per capita GDP growth. Annual average US per capita GDP growth fell from 2.8% in 1969, to 2.7% in 1977, to 2.4% in 2002, to 1.2% by the first quarter of 2017. The latest US data shows no break with this trend of long term slowdown – it is in line with it and continues these long term trends.
This data shows clearly claims the US economy is currently ‘dynamic’ driven by a ‘wave of innovation’ are therefore factually false – a pure propaganda myth repeated by US media such as Bloomberg with no connection with factual trends. US per capita growth has in fact fallen to a low level.
This fall of US per capita GDP growth to a low level clearly has major political implications within the US and underlies recent domestic political events. Very low US per capital growth, accompanied by increasing economic inequality, has resulted in US median wages remaining below their 1999 level – this prolonged stagnation of US incomes explaining recent intense political disturbances in the US around the sweeping aside of the Republican Party establishment by Trump, the strong support given to a candidate for president declaring himself to be a socialist Sanders, current sharp clashes among the US political establishment etc.
Cycle and trend
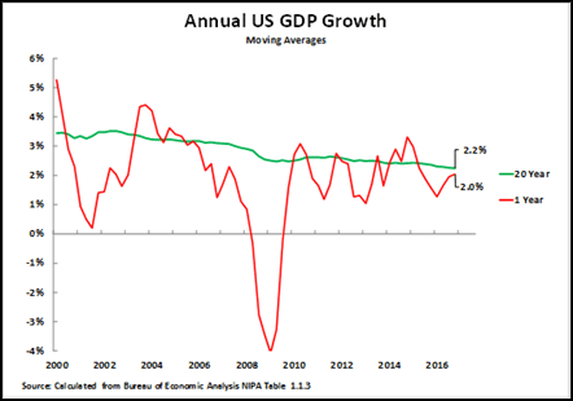
Turning from long term trends to analysis of the current US business cycle it may be noted that a 5-year moving average of annual US GDP growth is 2.0%, a 7-year moving average 2.1% and the 20-year moving average 2.2%. Leaving aside a 10-year moving average, which is greatly statistically affected by the severe recession of 2009 and therefore yields a result out of line with other measures of average annual growth of only 1.4%, US average annual GDP growth may therefore be taken as around 2% or slightly above. That is, fundamental structural factors in the US economy create a medium/long term growth rate of 2.0% or slightly above. Business cycle fluctuations then take purely short term growth above or below this average. To analyse accurately the present situation of the US business cycle therefore recent growth must be compared with this long-term trend.
Figure 4 therefore shows the 20-year moving average for US GDP growth together with the year on year US growth rate. This shows that in 2016 US GDP growth was severely depressed – GDP growth in the whole year 2016 was only 1.6% and year on year growth fell to 1.3% in the second quarter. By the 1st quarter of 2017 US year on year GDP growth had only risen to 2.0% – in line with a 5-year moving average but still below the 20-year moving average.
As US economic growth in 2016 was substantially below average a process of ‘reversion to the mean’, that is a tendency to correct exceptionally slow or exceptionally rapid growth in one period by upward or downward adjustments to growth in succeeding periods, would be expected to lead to a short-term increase in US growth compared to low points in 2016. This would be purely for statistical reasons and not represent any increase in underlying or medium/long US term growth. This normal statistical process is confirmed by the acceleration in US GDP growth since the low point of 1.3% in the 2nd quarter 2016 – growth accelerating to 1.7% in 3rd quarter 2016 and 2.0% in 4th quarter 2016 and 1st quarter 2017.
President Trump’s administration may of course claim ‘credit’ for the likely short term acceleration in US growth in 2017 but any such short-term shift is merely a normal statistical process and would not represent any acceleration in underlying US growth. Only if growth continued sufficiently strongly and for a sufficiently long period to raise the medium/long term rate average could it be considered that any substantial increase in US economic growth was occurring. The latest US growth data, 2.0% year on year, however does not represent any acceleration in US growth compared to longer term averages and is therefore in line with the pattern of US slow growth and does not represent a break with it.
Key determinants of US growth
Turning to the causes of this slow US growth, and therefore evaluation of the possibility of overcoming it, statistical analysis shows numerous factors explain purely short term fluctuations in US growth. Factors ranging from fiscal or monetary policy, to international trade fluctuations, even to the weather may therefore affect short term US growth. However, over anything except the short term Table 1 shows clearly that two factors are decisive in US growth – total US net saving/capital creation (the sum of household, company and government saving) and US net fixed investment. Over a 5-year time frame the correlation of the percentage of net savings in US GDP and the percentage of net fixed investment in US GDP with US growth is over 0.5, more powerful than any other factors, while over an 8-year time frame the correlation of net fixed investment with GDP growth is an extremely strong 0.72.
Consequently, while over the short term numerous factors are correlated with US short term growth, making short term trends difficult to predict, over a medium-long term frame the correlation of US economic growth with US net savings and net fixed investment is decisive.
It is unnecessary for present purposes to analyse whether US net fixed saving and US net fixed investment causes economic growth, or economic growth causes high net fixed savings and net fixed investment, or a third process causes both – it is merely sufficient to note that these high correlations means that over the medium/long term US GDP growth cannot be substantially increased without an increase in either US net savings or US net fixed capital investment. As changes in US net savings and net fixed capital investment have significantly different implications for US domestic and foreign policy and politics they will be considered in turn.
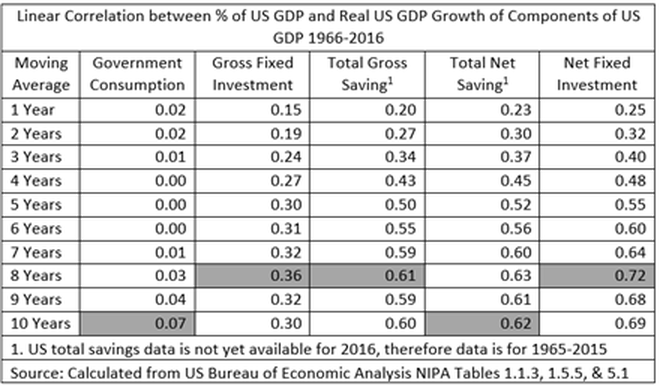
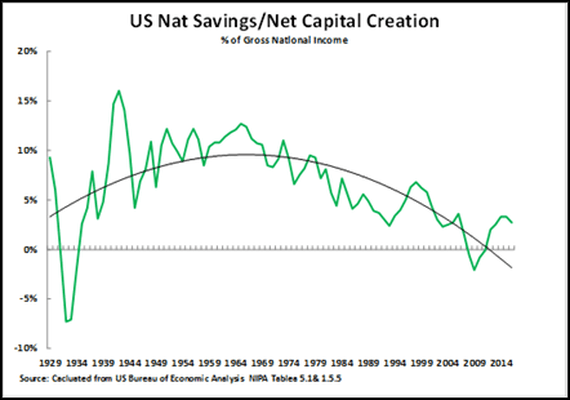
Figure 5 shows the long-term trend of US net savings/net capital accumulation since 1929. The curve of long term development of the US economy can be seen clearly and the slow growth of the US economy in the present period therefore placed in a clear historical context:
- During the deep crisis at the beginning of the Great Depression in 1929-33 US net capital accumulation was negative – the US economy was consuming more capital through depreciation than it was creating. This necessarily produced deep economic crisis. After this the rate of US savings/capital creation rose, with a powerful acceleration during World War II, to reach a long-term peak as a percentage of the US economy in 1965. This coincided with the great boom in the US economy during World War II and decades immediately following it.
- After 1965 US net savings/capital creation steadily fell as a percentage of the US economy until it once again became negative during the ‘Great Recession’ in 2008-2009. Given the strong correlation of US net saving/capital creation with US growth this declining trend of US capital creation naturally explains the long-term growth US slowdown that was shown above.
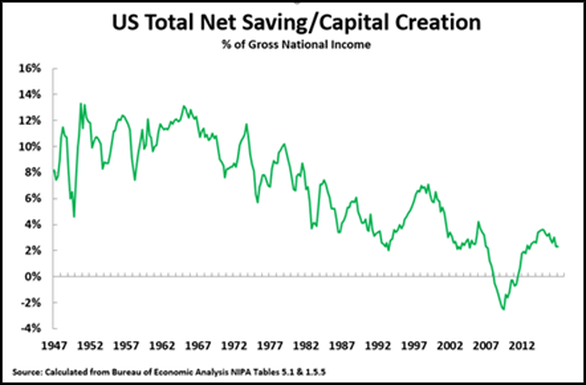
Turning to the latest data for the 1st quarter of 2017, to analyse if there has been any break with the long-term trend, Figure 6 clearly shows that at the latest date available there has been no long-term recovery in US net capital creation. Naturally there has been some recovery since the extreme depth of the financial crisis, when US net capital creation again became negative, but the present level of US net saving is still below the pre-crisis period. Furthermore since 4th quarter 2015 there has been a small but definite fall in the share of net saving in the economy – a decline from 3.3% of Gross National Income (GNI) in 4th quarter 2015 to 2.3% of GNI in 1st quarter 2017. As an extremely strong correlation exists between US net capital creation and medium/long term US GDP growth a medium/long term US economic acceleration could only take place when there was a major increase in US net capital creation – which has not occurred.
As investment must necessarily be financed by an exactly equal amount of savings it may therefore be noted that no increase in the percentage of US domestic resources available for investment has taken place.
The implications for US domestic politics
Turning from economic trends to their implications for US politics, as US net savings are US domestic capital creation, and the total US economy is necessarily equal to consumption plus savings, any attempt to increase the level of net capital creation in the US economy has major implications for US politics as it reduces the proportion of the economy allocated to consumption by the US population.
Purely in principle, the level of US net capital creation/net savings could be raised without attacks on the living standards of the US population. In particular US military expenditure, from a technical economic point of view, is a form of consumption. Reducing US military expenditure could therefore raise US savings without lowering the proportion of the economy devoted to the population’s living standards. However, the Trump administration has rejected this policy – projecting a major increase in US military expenditure.
Other measures by the Trump administration to increase the percentage of the US economy devoted to net capital creation would necessarily be politically unpopular under conditions of slow US growth. For example
- Reducing the proportion of the US economy devoted to wages, with the aim of increasing company profits and therefore potential company savings, would be unpopular as it would involve a reduction of the proportion of the US economy devoted to the main source of the population’s income.
- Reduction of the US budget deficit (that is decreasing the level of government dis-saving) through reductions in state expenditure on health, education, social protection etc. would involve reduction in the population’s living standards.
For these political reasons, given the commitment to increased military spending, attempts by the Trump administration to increase US net savings are likely to be politically unpopular and therefore difficult. Indeed, if US taxes are cut without corresponding state expenditure reductions the resulting increase in the US budget deficit would actually reduce the US net savings level.
Net fixed investment
Turning to US net fixed investment, it should be recalled that total investment is equal to total savings.[2] However US investment does not necessarily have to be financed by domestic US savings. US investment can also be financed by foreign capital/savings and foreign borrowing. This, however, as analysed below, has major implications for US foreign policy.
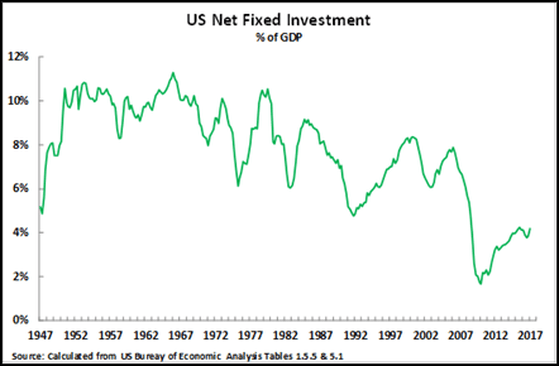
Analysing the fundamental data on US net fixed investment Figure 7 shows that the overall historical trend of this follows the same historical pattern as US net savings – reflecting that in the US, as in all major economies, the main source of financing of new investment is domestic. In more detail, historically:
- US net fixed investment was negative during the onset of the Great Depression – that is more capital was being consumed through depreciation than was being newly invested.
- US net fixed investment then rose very sharply during World War II and the decades long boom following it, before declining from the mid-1960s onwards. This decline was correlated with the long slowdown of the US economy shown above in Figure 2.
The chief difference to be noted between the trends in US net fixed saving and those of US net fixed investment is that during the international financial crisis after 2007 US net fixed investment fell to a very low level but did not become negative as US net savings did. The reason for this is that during the international financial crisis the US continued to finance its fixed investment through foreign borrowing – as analysed below.
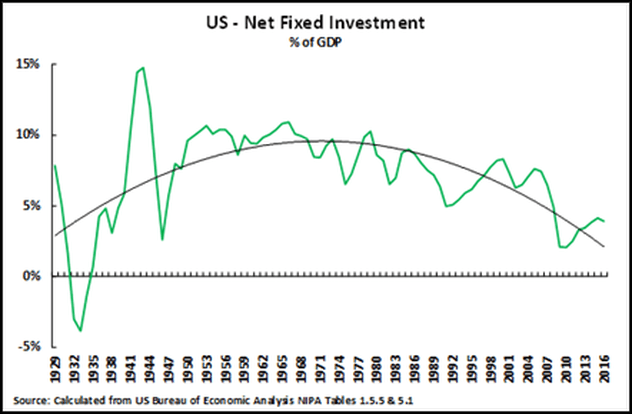
Turning to the latest data, for 1st quarter 2017, Figure 8 shows that there has been no fundamental recovery in the US net fixed investment level. There is again naturally a recovery from the extremely low level during the 2007-2009 international financial crisis but US net fixed investment remains substantially below pre-financial crisis levels.
Given the close correlation of US medium/long term economic growth with US net fixed investment no basis therefore exists at present for any medium/long term US economic growth acceleration.
The possibility of US foreign borrowing
The considerable domestic US political obstacles to increase US domestic savings were analysed above. However, an increase in US investment could in principle also be financed by foreign borrowing. What, therefore, are the practical possibilities of an increase in US investment financed from foreign savings/capital?
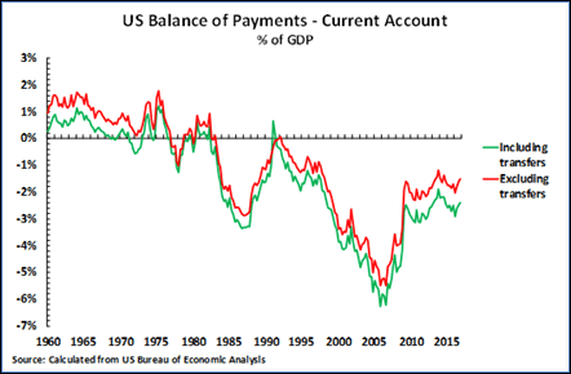
To analyse this precisely, it should be noted that statistically the US balance of payments on current account is necessarily equal to the US capital account balance with the sign reversed – i.e an increased positive flow of foreign capital into the US must be reflected in a corresponding increase in the negative US balance of payments on current account. Figure 9 therefore shows the US current account balance of payments. The trends are clear:
- Prior to Regan’s election in 1980 the US balance of payments was close to balance. Excluding foreign transfers, which were primarily payments on US overseas military expenditure and foreign aid typically tied to US foreign policy objectives, the US balance of payments was usually in surplus. Therefore, prior to Reagan the US was not dependent on, and did not undertake, significant net foreign borrowing;
- Under Reagan a new policy was adopted of large scale US foreign borrowing. This may be seen in the very sharp deterioration in the US balance of payments during the Reagan period – the US balance of payments on current account worsened from a surplus of 0.3% of GDP in the 4th quarter of 1980, the last quarter before Reagan came to office, to a deficit of 3.4% of GDP by the 3rd quarter of 1986. This 3.7% of GDP worsening of the US balance of payments is equivalent to over $700 billion at today’s prices.
- Under George H. W. Bush (Bush Senior) the US temporarily abandoned large scale foreign borrowing. With foreign sources of financing US investment reduced US net fixed capital formation fell sharply, from 7.5% of GDP in the last quarter of 1988 to 4.8% of GDP in 1st quarter 1992. The US fell into recession in the last quarter of 1990/1st quarter 1991 – the unpopularity of this leading to Bush’s electoral defeat.
- Under Clinton and George W Bush US foreign borrowing increased massively, rising to 6.3% of GDP by the last quarter of 2005 – such huge borrowing was unsustainable, was a significant contributory factor to the international financial crisis, and necessarily had to be reduced.
- The onset of the international financial crisis forced a huge reduction in US foreign borrowing – reducing net inflows of capital into the US from 5.3% of GDP in 1st quarter 2007 to 2.5% of GDP in the 2nd quarter of 2009. The level of US foreign borrowing has since remained essentially unchanged – net inflows of capital into the US were 2.4% of GDP in the latest available data in the last quarter of 2016.
If the US once again turned to financing its investment through a major increase in international borrowing there are very clear geopolitical and political consequences.
- Prior to Reagan US net export of capital/outward transfers from the US were a stabilising factor in the world economy – increasing the supply of capital for other countries and therefore aiding their economic development.
- After Reagan the reliance of the US on large scale foreign borrowing to finance its investment was a destabilising factor in the world economy – decreasing the supply of capital in other countries and thereby making more difficult their economic growth.
- As the US from Reagan onwards was dependent on large scale foreign borrowing to finance its investment, and given the strong correlation of US growth with net fixed investment, US growth became strongly dependent on sources of foreign capital.
Therefore, analysis of the ability of the Trump administration/US to tap large scale sources of foreign finance requires examining which countries could potentially supply this and the issues in US foreign policy this creates.
Can Trump achieve large scale foreign borrowing?
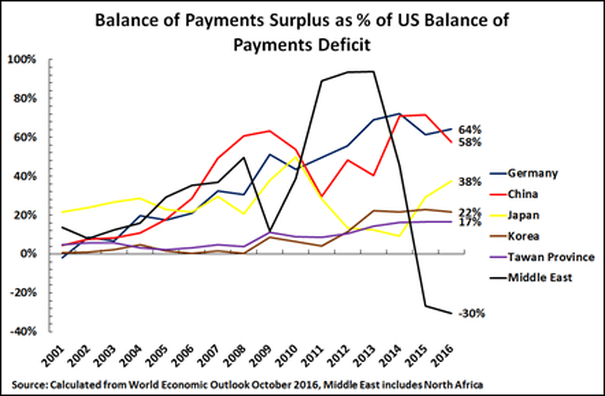
It was analysed above that considerable political obstacles exist to raising the US domestic savings level. However, the US obtaining capital/savings from other countries also raises significant issues in foreign policy – as becomes clear when it is analysed which countries could supply such capital/savings to the US as they possess large balance of payments surpluses. The fundamental data on this is shown in Figure 10 – in this chart the percentages at the end of the graph lines are for the country/region’s balance of payments surplus/deficit as a percentage of the US’s 2016 balance of payments deficit.
The source of the huge US foreign borrowing from Reagan to Clinton was clear – Japan. Japan’s balance of payment’s surplus was equivalent to 54% of the US balance of payments deficit under Reagan, 127% under George H.W. Bush, and 60% under Clinton. As Japan cannot defy the US on any major issue Japan could, therefore, easily be forced into policies which supplied capital to the US even if this damaged Japan’s economy – as indeed it did from the 1980s onwards in the creation of the ‘bubble economy’.[3]
However, by the beginning of the 21st century, Japan alone became too weak to finance a large part of the US deficit. During George W Bush’s presidency, 2001-2008, the percentage of the US balance of payments deficit that could be financed by Japan’s surplus fell to only 24% – too little to finance US needs. However fortunately for the US, prior to the international financial crisis, weakening of Japan’s ability to meet US financing needs did not lead to severe problems for the US as George W Bush found two additional international sources of finance. These were:
- Middle East oil exporters, whose balance of payment surplus was equivalent to 27% of the US balance of payments deficit due to the high oil price,
- China – whose balance of payment deficit was equivalent to 24% of the US balance of payments deficit.
The ability of the US to tap these two new sources of finance, however, necessarily entailed foreign policy choices. The easy one of these for the US was with the Middle Eastern oil exporters. Many of these (Saudi Arabia, Kuwait, UAE etc) are essentially in the same position as Japan in being entirely subservient to the US and can therefore, if necessary, be instructed/pressured to finance US deficits.
China, however, is not in that situation – it is not a semi-colony of the US or subservient to it. But George W Bush, throughout most of his presidency, maintained reasonable foreign policy relations with China – not seeking to create great tensions. This created a mutually beneficial situation in which China was content to de facto aid financing the US balance of payment deficit in return for no major trade or political tensions existing with the US.
The severe fall in the international oil price from mid-2014 onwards, however, sharply changed the situation for US borrowing by eliminating the balance of payments surpluses of the Middle East oil exporters – as shown in Figure 10. Recent aid from Saudi Arabia, following Trump’s trip to the Middle East, is useful but too small to fundamentally affect the situation of the US economy. The only countries with sufficiently large surpluses to finance very large scale borrowing by the US are China, with a balance of payment surplus equivalent to 58% of the US deficit, and Germany – with a balance of payments surplus equivalent to 64% of the US deficit.
It is for this reason that the key foreign policy countries for the US, from an economic viewpoint, are now China and Germany – Russia is important for the US geopolitically and militarily but not economically. To revive US economic growth by foreign borrowing either or both China and Germany must be peruaded or forced into substantially increasing supplies of capital to the US. This, of course, in turn necessitates key foreign policy decisions by the US.
Geopolitical conclusions
The geopolitical conclusions flowing from these fundamental economic factors are clear – the implications for domestic political instability in the US have already been analysed. The rational US economic course, to minimise geopolitical risk and domestic political tension, would be to increase its net savings/net fixed investment via a reduction in military expenditure. This however, has already been rejected by the Trump administration. Therefore, regarding Germany and China:
- In the run up to Trump’s election, and early in this presidency, he clearly attempted to intimidate/pressure Germany into greater economic subordination to the US. Politically this was carried out by reversing the historic US policy of support for the EU and instead seeking to weaken/break it up by supporting anti-EU currents such as Brexit and LePen in France. This led to a clear clash with Germany – for which the EU represents a decisive economic reserve and chief market. Merkel made clear Germany was not prepared to subordinate its interests to Trump’s requirement either by an inordinate increase in German military expenditure or accepting US protectionism. Germany also secured a crucial strategic political victory against Trump with the overwhelming election of Macron against LePen in the French Presidential election. These clashes between US and German policy were clearly reflected at the recent G7 summit and in Merkel’s declaration following it, in which she was clearly referring to the US, that: ‘The times in which we can fully count on others are somewhat over, as I have experienced in the past few days.’ German diplomacy followed this up actively with in rapid succession the visit of Indian Prime Minister Modi to Germany, the visit of China’s premier Li Keqiang to Germany, and the invitation of Putin to visit France by Macron – such an invitation was clearly discussed by Macron in advanced with Merkel. It is important not to exaggerate, a serious split between Germany and the US on military matters is not possible. But refusal of Germany to be intimidated into significantly subordinating itself to US economic demands blocks one of the only two major sources of large scale foreign capital which could be transferred to the US.
- Regarding China, the other major potential foreign source of capital, Trump’s team again initially appeared to attempt intimidation – the notorious phone call with Taiwan leader Tsai Ing-wen in violation of the bedrock ‘One China’ policy followed by the US since establishment of diplomatic relations with China, the bringing of hard line anti-China ideologues such as Navarro and Barron into the administration etc. However, China made clear it would not accept any intimidation regarding ‘core interests’ such as the One China Policy, the South China Sea etc. China is certainly correct to propose positive ‘win-win’ policies for both the US and China, but it is not subordinate to the US as Japan was – and therefore will now allow its economy to be fundamentally damaged to subsidise the US, as Japan did, and China will not be intimidated regarding fundamental issues.
The US therefore certainly has some economies (Japan, Middle East oil exporters, Taiwan province) that are entirely subordinate to its policies and which can transfer capital to it – but, unlike in the Reagan period, these are now too economically weak to meet the needs of very large scale US foreign borrowing. The only two economies which could potentially transfer capital/savings to the US on a sufficiently large scale, Germany and China, are too strong to be economically intimated to the US. Germany and China certainly seek ‘win-win’ outcomes with the US but they cannot be intimidated into undertaking policies which would finance the US at the cost of serious damage to their own economies.
Therefore, unless either Germany or China can be persuaded/forced into large scale capital transfers to the US the basis for accelerating US economic growth through very large scale foreign borrowing does not exist at present.
IMF predictions
Finally, while the above analysis is made in terms of economic fundamentals, in case it may be argued that the above analyses suffer from a ‘pessimism bias’, an underestimation of the growth potential of the US, it worth doing a cross check against the implications of IMF projections. These show that in terms of medium/long term growth the IMF projects that the US economy will not accelerate but even slow further.
In the next six years 2016-2022 the IMF projects that annual average US GDP growth will be 2.0% – below the 20-year moving average for the US economy, although in line with the 5-year moving average. As a result, taking into account the sharp recession in 2009, US long term growth, the 20 year moving average, will actually fall further to 1.9%. This is shown in Figure 11.
Once again it is useful to make a comparison of the period since the international financial crisis to that of the Great Depression after 1929. In the 15 years after 1929 US economy more than doubled in size, growing by 112%, an annual average 5.1%. In comparison IMF projections are that in the 15 years after 2007 the US will grow by 26%, with an annual average 1.6% growth. In short in the 15 years after 1929 US total economic growth was over times four times that projected in the 15 years after 2007, which results for a post-1929 average US growth rate over a 15 year period that was over three times that projected after 2007.
Conclusion for discussion in China
Analysis of the latest US GDP data therefore leads to a clear conclusion – the US remains locked in a period of slow growth which will last for at least a number of years. Claims to the contrary in sections of the media that there will be a substantial increase US growth, in anything other than a purely short term sense already analysed, results either from ‘wishful thinking’ or basic economic errors. As China’s policy, particularly on such a fundamental issue, must be based on the principle of realism and ‘seek truth from facts’, not on wishful or confused thinking, it is therefore worth analysing the errors of some claims in part of the media that there will be a substantial increase in US medium/long term economic growth.
- The simplest form of ‘wishful thinking’ is that it would be highly ‘helpful’ from the point of view of China’s trade and development if the US economy grew rapidly. This is undoubtedly true – but because something would be desirable does not mean it will happen!
- Since Trump’s election China has rightly proposed numerous forms of economic cooperation with the US – setting these out comprehensively in the Ministry of Commerce’s ‘Research Report on China-US Economic and Trade Relations’. This is extremely important in foreign policy terms, showing clearly the goodwill of China to the US, the search for win-win outcomes, and that any problems in US-China relations do not arise from China. Such proposals, because they are win-win can aid sectors of both the US and Chinese economies. But the sums of finance involved are not sufficient by themselves to overcome the deep-seated problems creating slow US growth which have been analysed. To give the scales of finance involved it may be recalled that the extra foreign borrowing undertaken under Reagan would be equivalent to over $700 billion at today’s prices.
- A confusion (whether deliberate or objective) is sometimes expressed in parts of the Chinese media between purely short term growth fluctuations and basic trends. For example, it was noted above that US growth has increased from an extremely depressed 1.3% in the 2nd quarter of 2016, and for statistical reasons it is likely that in 2017 US growth will increase from the low 1.6% annual level of 2016. Any such short-term acceleration in growth does not alter the fundamental trend of the US economy – only if such more rapid growth were continued for a significant period would it represent a basic acceleration in the rate of US growth.
- It is sometimes claimed that the US will experience rapid economic growth due to a ‘wave of innovation’. However, as has already been shown factually, the US has not been experiencing ‘rapid growth’ but very low growth. Furthermore, while there is ample evidence that innovation embodied in increasing fixed investment leads to faster growth, there is no evidence from the US that innovation which is not accompanied by increased fixed investment leads to rapid growth.
- It is sometimes claimed tax reductions proposed by Trump will lead to rapid growth. This is based both on errors in economic theory and wrong factual information regarding what occurred under Reagan – whose administration did cut taxes. First, tax cuts if unaccompanied by equivalent state spending reductions, increase the budget deficit and therefore reduce the overall domestic US savings level – which, because of the close correlation of net savings and growth will reduce GDP growth. Second, Reagan used massive foreign borrowing to sustain US growth as was shown in Figure 9. Certainly, if Trump could achieve huge foreign borrowing by the US growth would be expected to increase during the period of such borrowing. But as already analysed only two countries have the resources necessary for this, Germany and China, and for different reasons neither is likely to supply the huge borrowing required.
Claims appearing in sections of the media that there will be a basic acceleration of the US economy from its present state of low growth are therefore false – as such analyses have been previously tested and rejected by events during the very prolonged slowdown of the US economy analysed at the beginning of this article and was shown in Figure 2.
Practical Conclusion
The practical conclusions of this situation for China’s policy are clear and provide a clear backdrop showing the coherence of the initiatives taken by China under Xi Jinping.
The latest US data confirms there is no break in the trend of long term slow growth in the US. Numerous geopolitical conclusions affecting China follow from this – these are too numerous to analyse all here. However, some are fundamental:
- The fact that China has to base its economic perspective on the continuation of slow US growth for a prolonged period means that while initiatives are rightly being taken for ‘win-win’ outcomes between the two countries a very rapid increase of China’s exports to the US cannot be relied on. Furthermore, as the US is not merely the world’s largest economy, but it particularly influences trends in the other advanced Western economies. overall growth in the advanced economies will remain relative slow by historical standards.
- As this extremely slow growth is confined to advanced economies, and not to developing economies, it means that economic role of developing economies, and in particular the OBOR region, will be even more decisive for China. IMF projections are that total GDP growth in the developing economies from 2007-2021 will be 98% compared to only 21% in the advanced economies Measured at current exchange rates in 2016-2021 the OBOR region will account for 46% of world economic growth.
- The unfolding development of geopolitical and political events is significantly affected by the fact that while long term economic growth after 2007 in the Western economies is becoming even slower than after 1929 nevertheless the form is significantly different. The slow average growth during the ‘Great Depression’ after 1929 was produced by an extremely violent recession follow by sharp recovery in the majority of advanced economies. This extreme initial recession unleased rapid political crisis. In September 1931 Japan invaded Manchuria, beginning its military attack on China; in September 1931 Britain abandoned the gold standard, resulting in collapse of the then existing international financial system; in November 1932 Roosevelt was elected US President, leading to the ‘New Deal’, in January 1933 Hitler became German Chancellor. In contrast, after 2007 the initial recession was far less severe but the long term slow growth in the crisis was prolonged. Instead of being extremely rapid the political crisis after 2007 was therefore slow building and cumulative – leading eventually to key turning points such as Brexit and Trump’s election.
- Within the US as very slow growth will last for a prolonged period there will be a not rapid return to US political stability. The sharp turns represented by the election of Trump, the rise in support for Sanders, the continued severe fighting within the US political establishment over Trump and foreign policy will continue. While continuing with its correct policy of seeking ‘win-win’ solutions with the Trump administration China must, however, be prepared for sharp turns in the situation. This is why issues such as military reform, as emphasised by Xi Jinping, are correctly running side by side with economic initiatives such as OBOR and seeking win-win economic relations with the Trump administration.
The character of the international period
Finally, this continuation of very slow US growth confirms one of the two key features defining the present period facing China under Xi Jinping:
- Domestically, China is making the transition first to ‘moderate prosperity’ and then within a decade to a ‘high income’ economy by World Bank classification.
- Internationally China faces a situation of slow growth in the US and advanced economies.
This combination of domestic and international trends constitutes a new period in China’s development and has not faced any previous Chinese leader. This may therefore be understood as a background to the distinct policies launched under the Presidency of Xi Jinping.
Notes
[1] For economic specialists’ differences between the way GDP data is presented in the US and in China are explained here.
Some media reported US GDP growth in 1st quarter 2017 as 1.2%. This reflects the way the US Bureau of Economic Analysis presents the data – ‘real gross domestic product (GDP) increased at an annual rate of 1.2% in the first quarter of 2017.’ But it is not sufficiently widely understood that US GDP data is presented in a different way to China’s data.
US data in the above form is presented as the percentage growth between one quarter and the next on an annualised basis. That is, the new US data in that form is presented as the growth of 1st quarter 2017 compared to 4th quarter 2016 presented on an annualised basis. Actual US GDP growth between 4th quarter 2016 and 1st quarter 2017 was 0.3% on a seasonally adjusted basis – 1.2% on an annualised basis.
China however emphases presentation of GDP growth year on year growth – China’s GDP growth of 6.9% in 1st quarter 2017 was the change compared to 1st quarter 2016.
What may appear a technical issue has considerable significance due to a serious and known problem in the US data. The US method has the disadvantage that for accurate data the seasonal adjustment between quarters must be correct – different quarters of the year have features which strongly speed or slow growth in that period. But as is widely known among Western analysts the seasonal adjustment in US data for the 1st quarter of the year is inaccurate as it understates growth – the US statistical authorities are aware of this but have not so far succeeded in resolving the problem. To avoid this, it is better to use the system of comparing the 1st quarter of 2017 with the 1st quarter of 2016 – as this automatically avoids the need for seasonal adjustment. On that basis US year on year GDP growth was 2.0% not 1.2%. In order to avoid understating US growth this 2.0% is used in this article.
A second issue is that a market economy inherently displays business cycles. It is therefore necessary to separate purely cyclical trends from medium/long term ones. Such cyclical effects may be removed by using a sufficiently long term moving average that cyclical fluctuations become averaged out and the long term structural growth rate is shown – as is done in this article.
[2] From a theoretical point of view US savings and investment includes inventories as well as fixed investment. However taking a quarterly average since 1947 97% of US gross investment has been fixed investment and only 3% inventory formation, therefore by focusing here only on fixed investment and not dealing with inventories no significant distortion of trends occurs.
[3] To allow capital to flow out of Japan to the US, particularly after the 1987 Wall Street stock price crash Japan’s interest rates were held at a low level, therefore creating huge financial bubbles within Japan’s economy which duly exploded in the 1990s.
Related articles

Peak US growth under Trump slowest for any US President since World War II

NATO expansion destabilised Europe, further expansion would destabilise the world

Biden’s “democracy summit” – how Marx showed the fake character of capitalism’s concept of “human rights”

The American Way leads to Americans dying early